
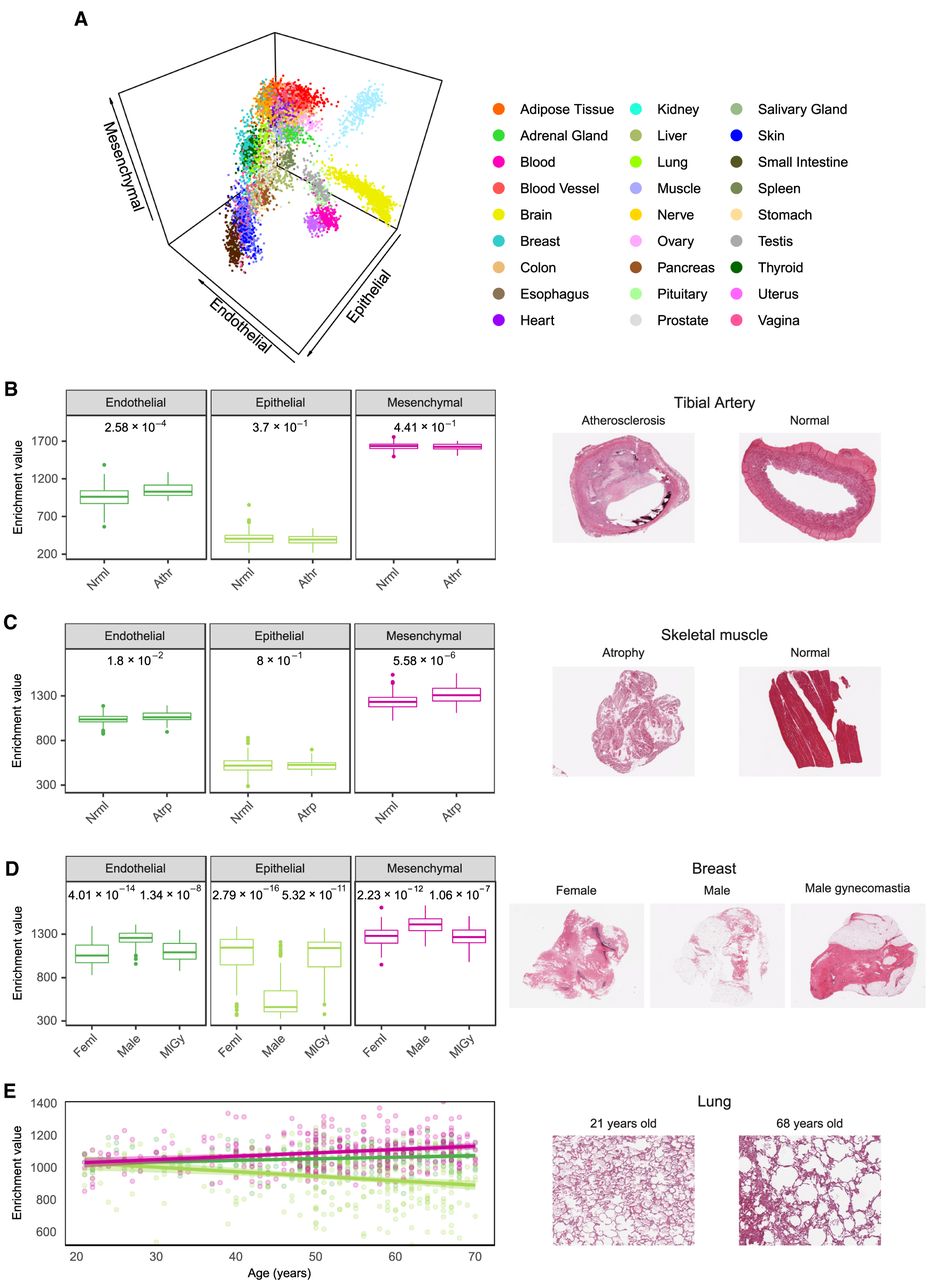
Alterations of the contributions of the major cell types to tissues in histological phenotypes. (A) GTEx samples represented in a 3D space in which the axes are the enrichments of endothelial, epithelial, and mesenchymal cells. (B,C) Differences in xCell enrichments of major cell types (Mann–Whitney U test, adjusted P-values as FDR) between affected and normal states. Histological images of affected and normal tissues are displayed (see text for details): (Athr) atherosclerosis (n = 31); (Atrp) atrophy (n = 34); (Nrml) normal (n = 285 and n = 388, respectively). (D) Major cell type xCell enrichments in female breast samples (Feml, n = 85), and male breast samples with (MlGy, n = 36) or without gynecomastia (Male, n = 85). Only significant FDR (≤0.05) are shown, all of them being between female and male without gynecomastia (left, FDR) and between male without gynecomastia and male with gynecomastia (right, FDR). (E) Changes in major cell type xCell enrichments in lung samples with age. Pearson's r and adjusted P-values as FDR: endothelial r = 0.17 and FDR = 3.2 × 10⁻³; epithelial r = −0.23 and FDR = 6 × 10⁻⁵; mesenchymal r = 0.25 and FDR = 2.4 × 10⁻⁵.


