
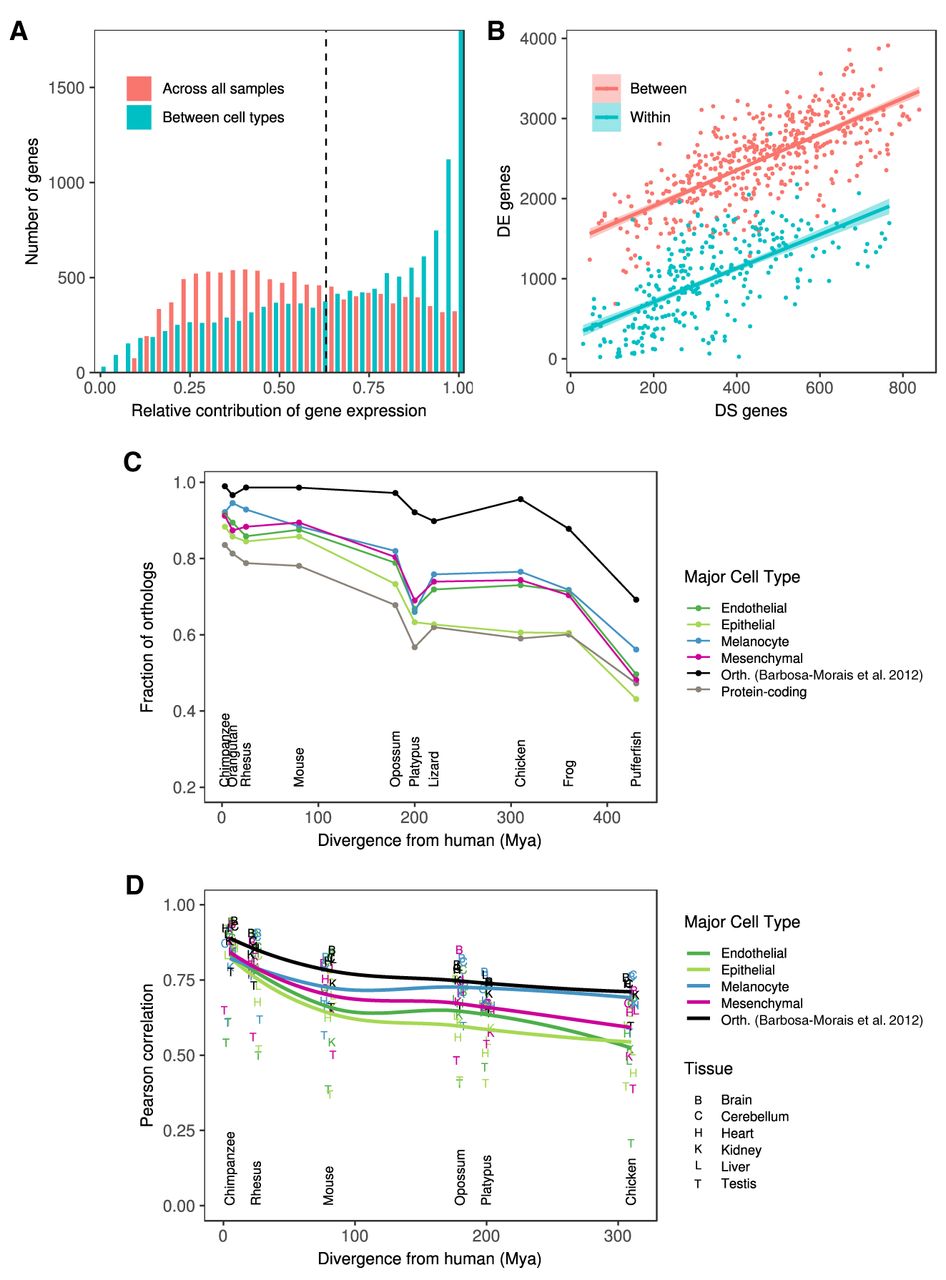
Transcriptional complexity of human primary cells and evolutionary conservation of cell-type-specific genes. (A) Distribution of the relative contribution of gene expression to the variation in isoform abundance between major cell types (blue) and between all primary cells. Large values of the contribution of gene expression indicate that changes in isoform abundance from one condition (primary cell, cell type) to another can be simply explained by changes in gene expression. Small values, in contrast, indicate that changes of isoform abundance are mostly independent of changes in gene expression and can obey changes in the relative abundance of the isoform. (B) Number of differentially expressed genes (DE, y-axis) versus the number of genes with differentially spliced exons (DS, x-axis), between pairs of samples of the same cell type (within, blue), or different cell types (between, red). DS genes have been obtained using IPSA (https://github.com/pervouchine/ipsa-full). See also Supplemental Figure S19. (C) Fraction of 1 to 1 orthologs between each species and human for major cell-type-specific genes and for protein-coding genes overall. Species are sorted by increasing evolutionary distance from human. The black line is given as a reference, and it indicates the proportion of six-way orthologs (chimpanzee, rhesus, mouse, opossum, platypus, and chicken) that are present in each species. The proportion is not 100% in these species because different versions of the GENCODE gene set reference were used. The genes in this set of six-way orthologs are used for the comparison of gene expression in Supplemental Figure S22A. See also Supplemental Figure S22C. (D) Pearson's r between gene expression in each human organ and the corresponding one in every other species. The correlation is computed across all the genes in each major cell type separately. See also Supplemental Figure S23.


