
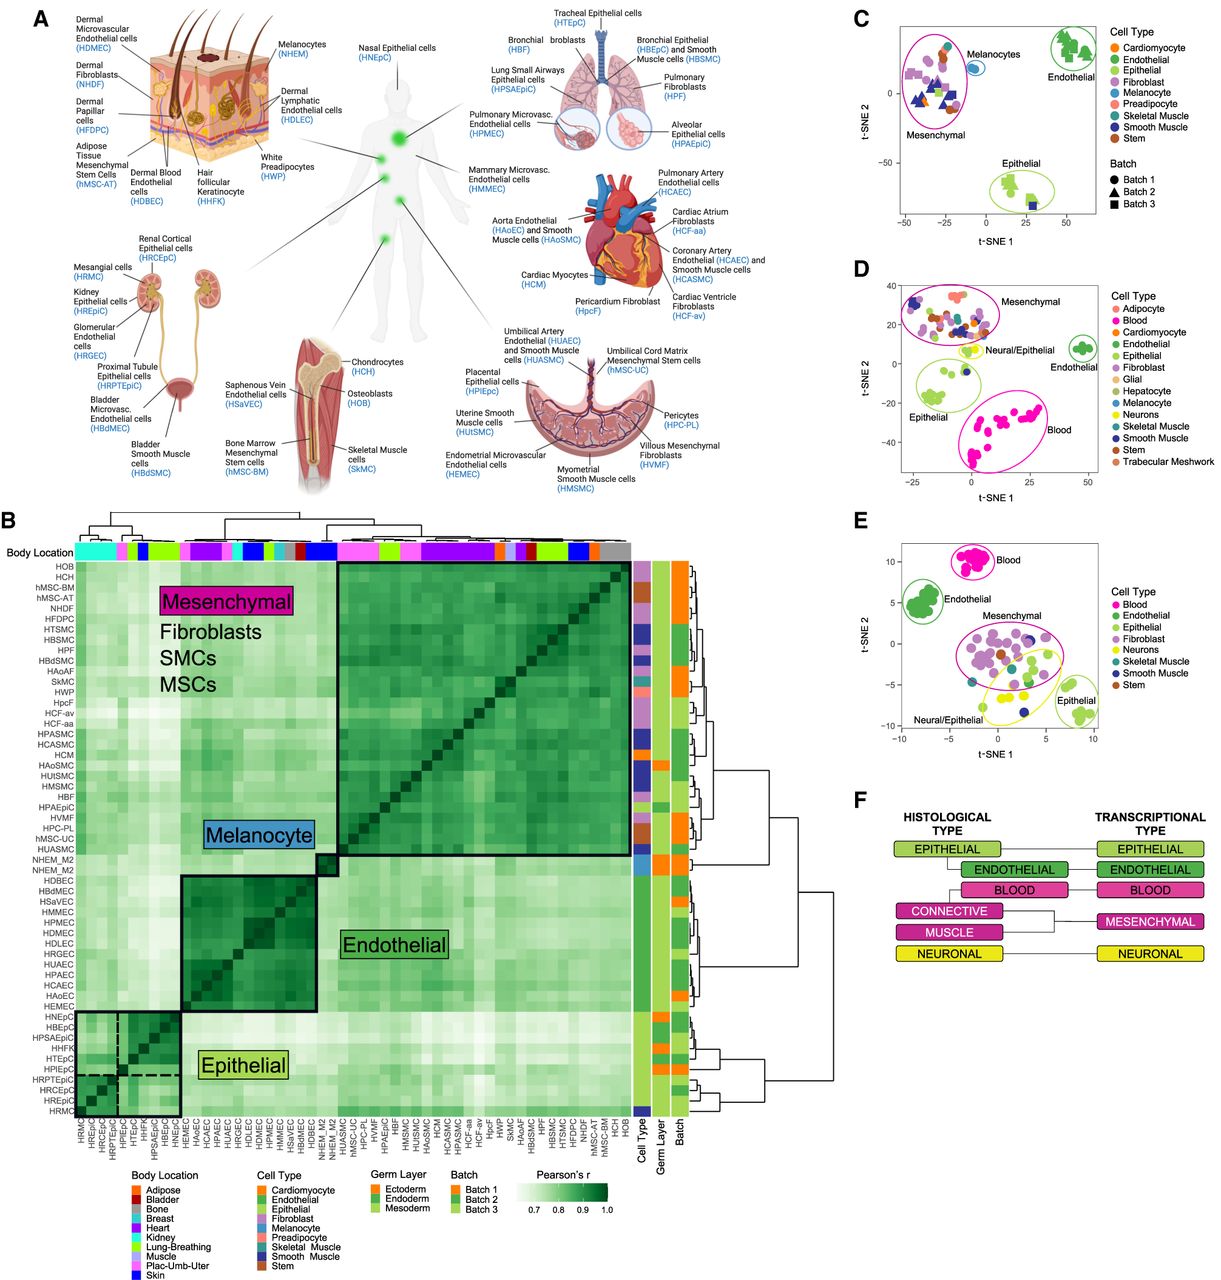
Basic transcriptional programs of human primary cells. (A) Overview of primary cells analyzed in this study and the body location they are extracted from. (B) Hierarchical clustering of human primary cells based on the correlation of gene expression. The clustering in four major clusters is supported by the silhouette analysis and the elbow method (Supplemental Fig. S2A,B). t-SNE of human primary cells based on gene expression measured here (C), on gene expression measured by CAGE by the FANTOM Consortium (D), and on candidate regulatory elements (cREs) by the ENCODE Encyclopedia scored DNase I hypersensitivity signal (E). (F) Correspondence between transcriptionally derived major cell types and classical histological types.


