
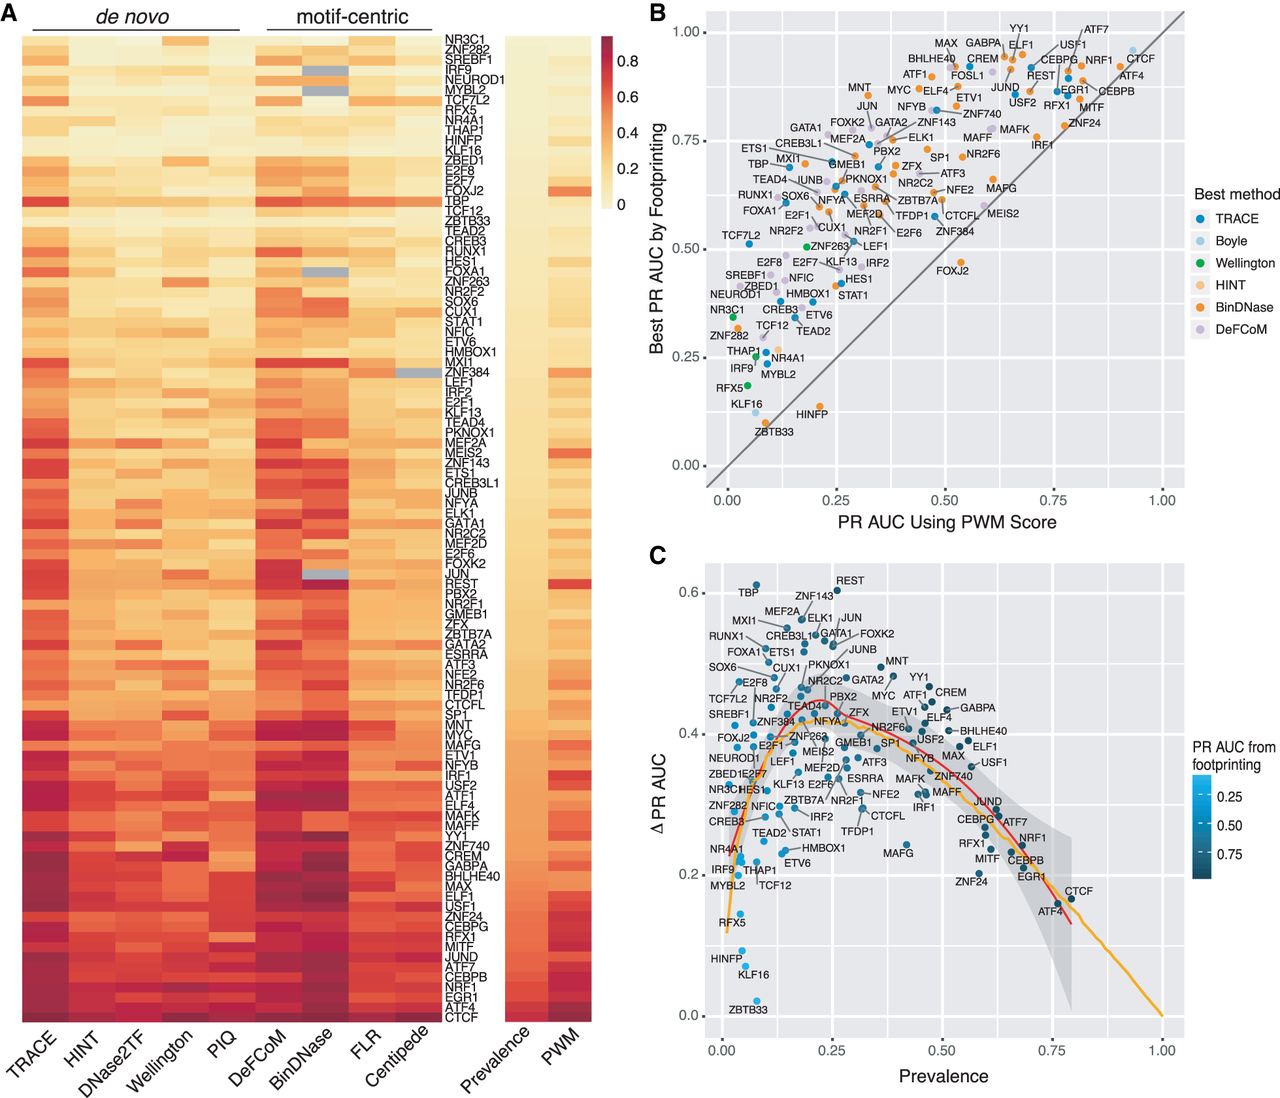
Figure 4.
Computational footprinting methods share similar performance patterns. (A) Heatmap of PR AUC of all TFs tested from existing methods sorted by prevalence. (B) Comparison between the best PR AUC among all footprinting methods (y-axis) and PR AUC from using PWM score alone (x-axis) for every TF tested. (C) Performance improvement of footprinting methods over permutation for each TF colored by its best PR AUC from footprinting. Orange line is from a simulation test using positive instances drawn from N(10, 8), and negative instances from N(0, 7) to show expected PR AUC trend as binding prevalence changes.


