
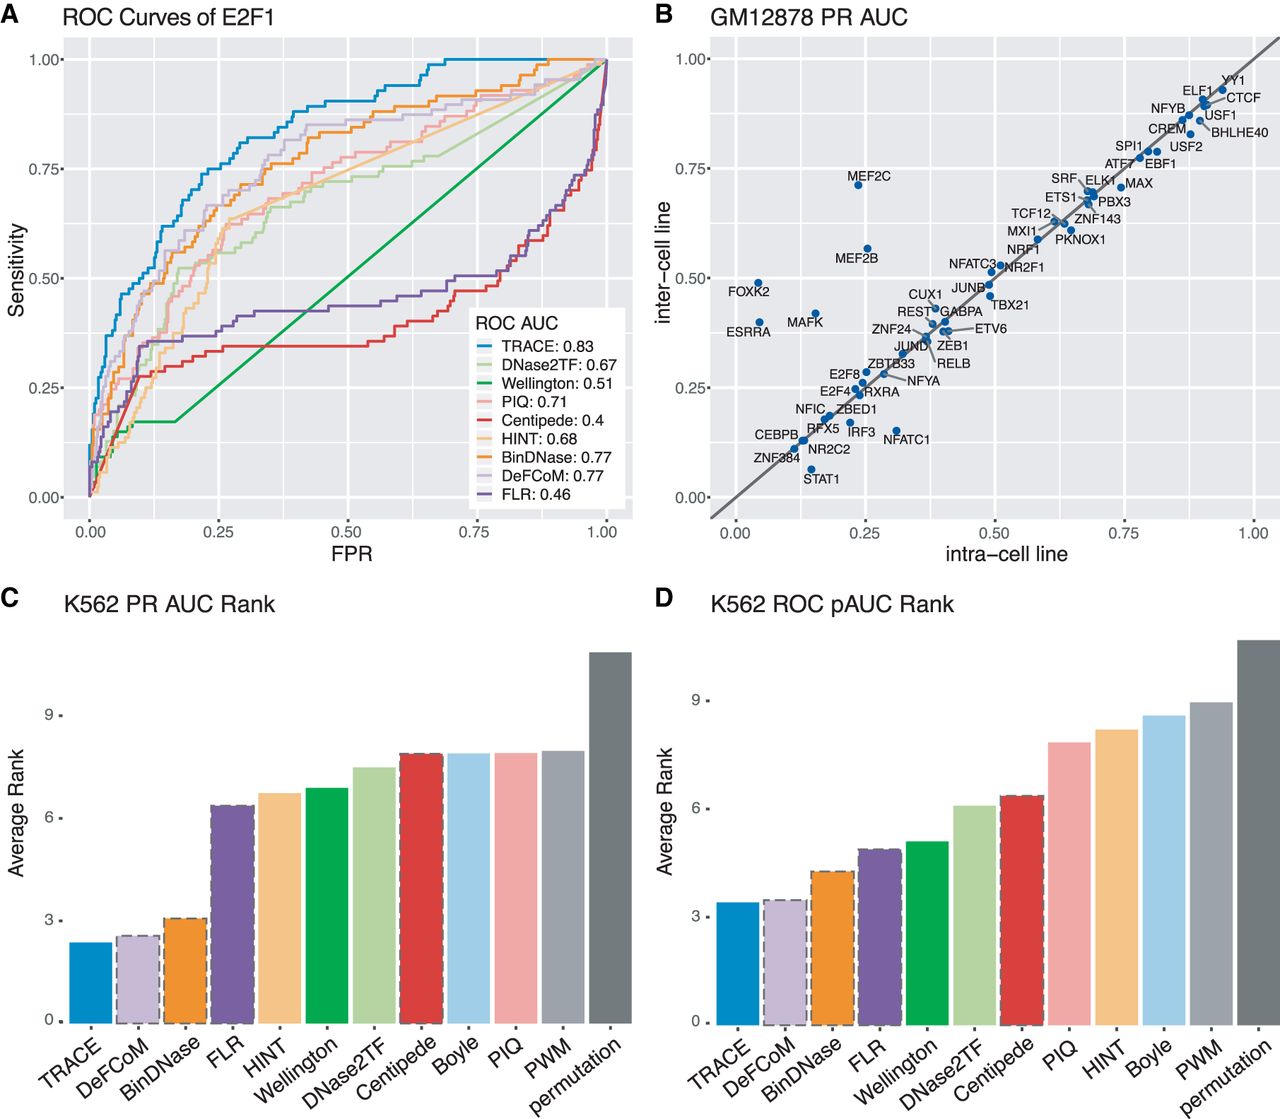
Figure 2.
TRACE's performance is stable across cell lines, and it outperforms other computational methods. (A) Example ROC curves of E2F1 for all methods evaluated. (B) Cross–cell line comparison of binding site prediction in GM12878. Each point represents a TF tested; the x-axis and y-axis are PR AUCs of applying TRACE using models trained from GM12878 and models trained from K562, respectively. Points above the diagonal line indicate TFs for which the inter–cell line model performed better. (C,D) Average rank of PR AUC and ROC pAUC of existing methods across all TFs tested. The bars with a dashed outline represent motif-centric methods.


