
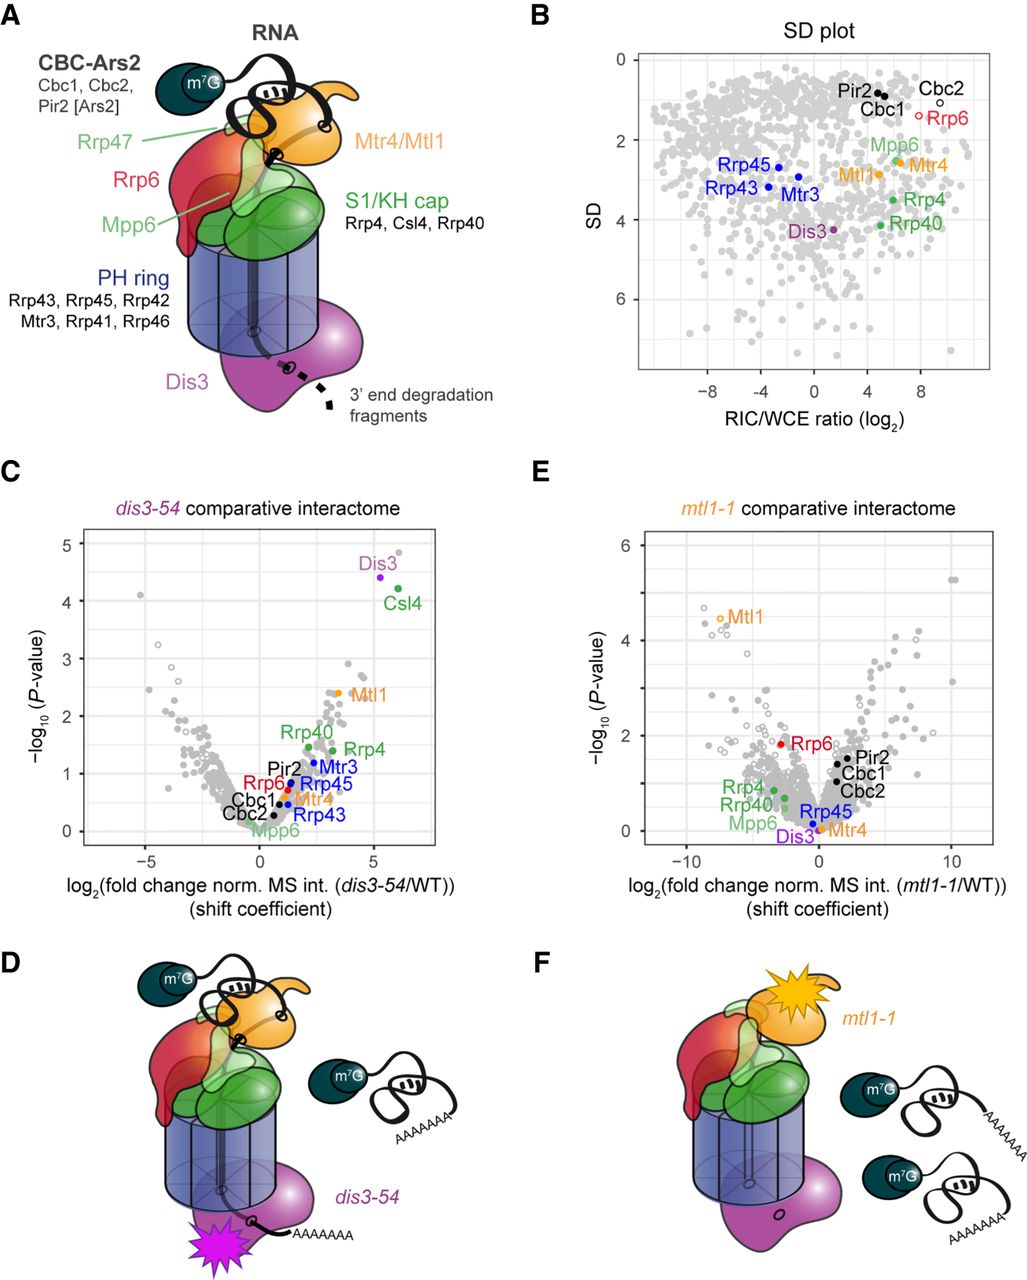
Comparative RIC with exosome mutants captures quantitative differences in RNA channeling. (A) Schematics of the nuclear RNA exosome complex based on crystal structures of the complex (Makino et al. 2013, 2015; Schuch et al. 2014; Zinder et al. 2016). (B) SD plot of the WCE-normalized poly(A)+ RNA interactome as in Figure 3B with components of nuclear exosome highlighted. (C) Volcano plot of a comparative RIC experiment for dis3-54. P-values (−log, moderated Student's t-test) for the comparison between RIC/WCE ratios of mutant and WT interactomes were plotted against the fold change of RIC/WCE ratios between mutant and WT (shift coefficient; n = 3). Components of the nuclear exosome are highlighted. Full circles denote proteins that were detected in the mutant interactome, and empty circles denote proteins that were not detected (but were present in WT). Shift coefficients for individual proteins can be found in Supplemental Table S4. (D) Impairment of Dis3 exonucleolytic activity leads to accumulation of nuclear RNPs, a part of which associate with the exosome complex but fail to be degraded. (E) Volcano plot of a comparative RIC experiment for mtl1-1 as in C. (F) Mtl1 facilitates engagement of the exosome complex with substrate RNA. In the mutant, nuclear RNPs accumulate but do not engage with the exosome complex.


