
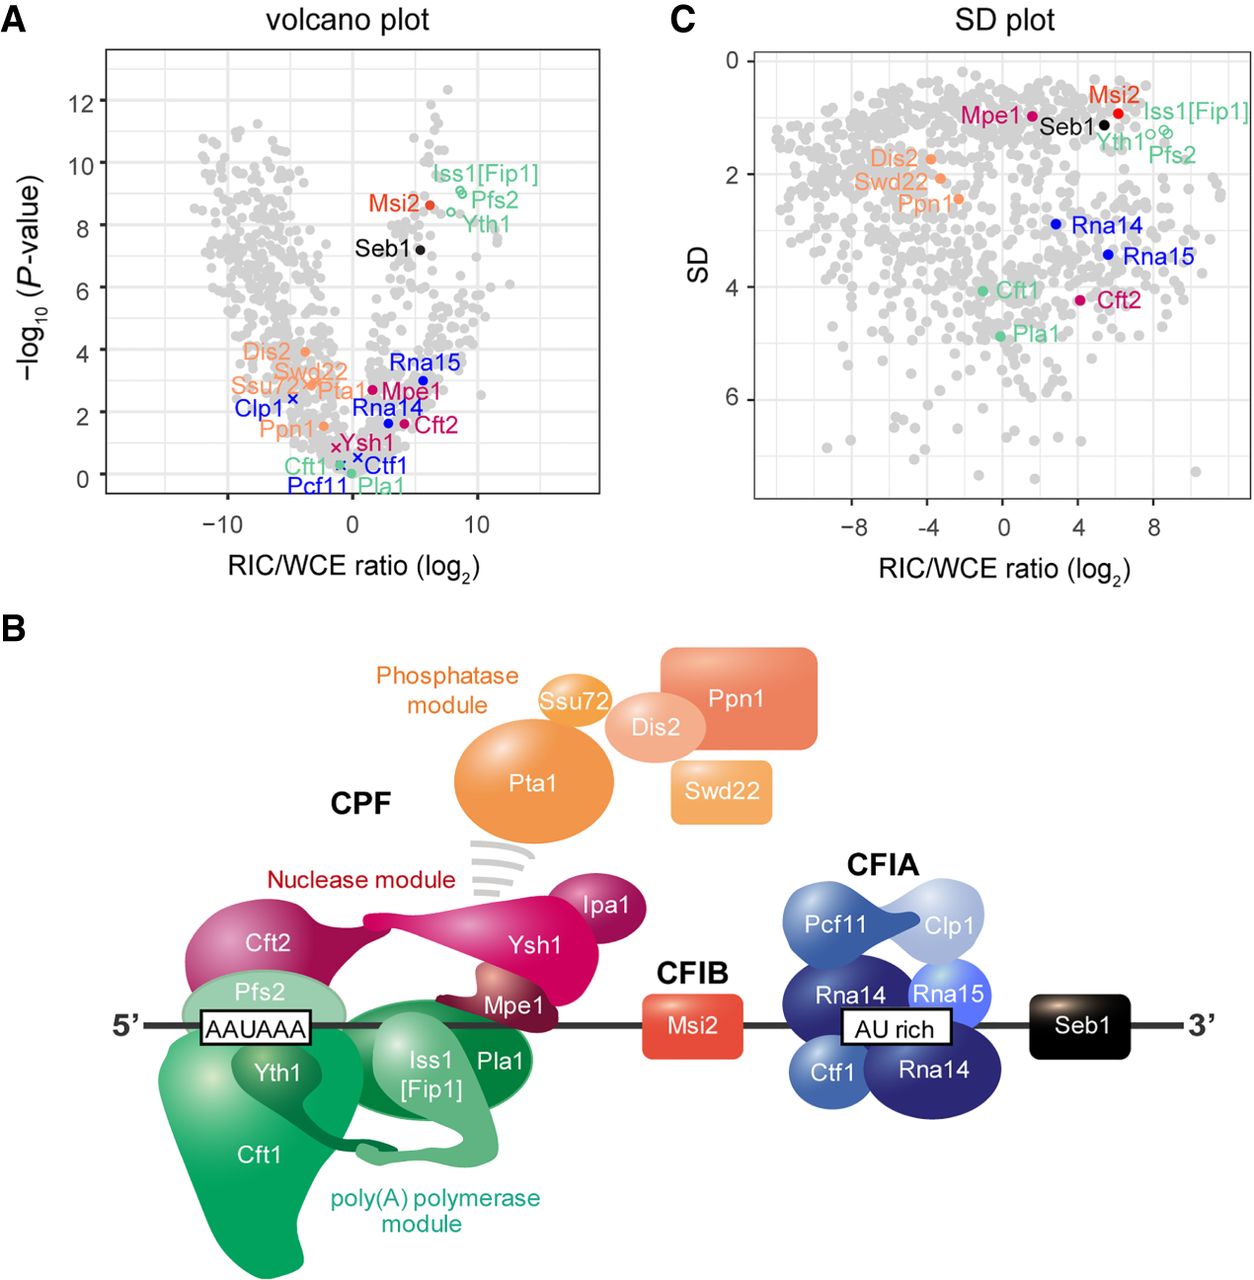
Normalized RIC data captures aspects of multiprotein complex topology. (A) Volcano plot of the WCE-normalized poly(A)+ RNA interactome as in Figure 1D. Components of CFIA, CFIB, and CPF are highlighted. (B) SD plot of the WCE-normalized poly(A)+ RNA with components of CFIA, CFIB, and CPF highlighted. SD was plotted against the fold change of mean MS intensities (log2) of proteins recovered from the oligo(dT) pull-downs of UV-crosslinked samples (3 J/cm2) over the input WCE (RIC/WCE ratios; n = 6). Only proteins that were detected in the oligo(dT) pull-down were included in the graph. Background values were imputed for proteins without WCE signal (empty circles). (C) Putative model showing the organization of the S. pombe 3′ end processing machinery for RNA Pol II on RNA. Overall complex organization is based on published structural data (Barnwal et al. 2012; Clerici et al. 2017, 2018; Sun et al. 2018; Hill et al. 2019).


