
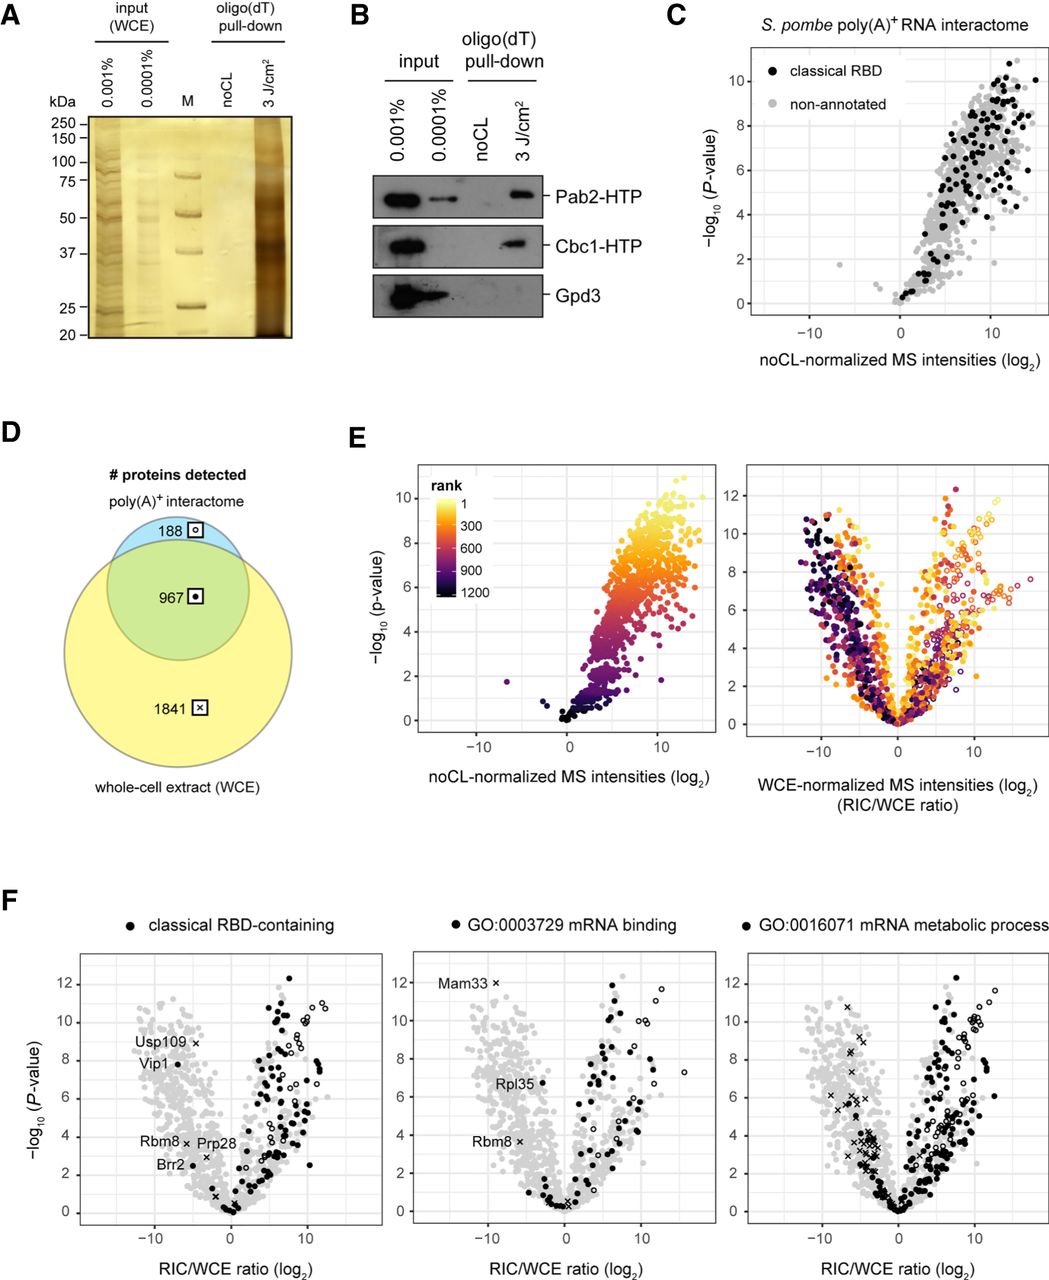
Poly(A)+ RNA interactome capture in S. pombe. Quality control of a representative RIC experiment using silver staining (A) or western blotting (B) of input and proteins eluted from oligo(dT) beads. RNA interactors were only recovered if cells were irradiated with UV before harvesting (3 J/cm2), but not from the non-crosslinked controls (noCL). Known RBPs such as the poly(A)-binding protein Pab2 or the cap-binding protein Cbc1 were robustly detected in the crosslinked samples; the abundant metabolic enzyme Gpd3 was not. (C) Mass spectrometry (MS) analysis of the S. pombe poly(A)+ RNA interactome. In the volcano plot, P-values (−log, moderated Student's t-test) are plotted against the fold change of mean MS intensities (log2) of proteins recovered from the oligo(dT) pull-downs of UV-crosslinked samples (3 J/cm2) (n = 6) normalized to noCL controls (n = 3). Background values were imputed for proteins without signal in the noCL control. Proteins annotated with a classical RNA-binding domain (RBD) are designated in black. The corresponding data can be found in Supplemental Table S1, and the list of Pfam identifiers used for this analysis are in Supplemental Table S2. (D) Overlap of proteins detected in oligo(dT) pull-downs from UV-crosslinked cells (3 J/cm2) and the corresponding whole-cell extracts (WCE) (n = 6). In all downstream analyses, the indicated symbols are used to designate proteins from a given population: full circles for proteins detected in oligo(dT) pull-down and WCE; empty circles for proteins detected in oligo(dT) pull-downs but not the WCE; crosses for proteins detected in the WCE but not the oligo(dT) pull-downs. (E) Impact of normalization method on relative RBP enrichment in the poly(A)+ RNA interactome. P-values (−log, moderated Student's t-test) are plotted against the fold change of mean MS intensities (log2) of proteins recovered from the oligo(dT) pull-downs of UV-crosslinked samples (3 J/cm2) over either noCL controls (left) or the input WCE (RIC/WCE ratios, right) (n = 6). For WCE normalization (right), background values were imputed for proteins without WCE signal (empty circles) and raw MS intensities were normalized to median = 0 before calculating fold-change values. In both panels, individual proteins are colored according to the statistical significance (ranked P-values) of protein enrichment in the noCL-normalized interactome. (F) Distribution of proteins annotated with a classical RBD (left), GO function “mRNA binding” (middle), or GO process “mRNA metabolic process” (right) in the WCE-normalized RNA interactome designated in black, using symbols to indicate protein populations as in D. Background values were imputed for proteins without signal in any given sample.


