
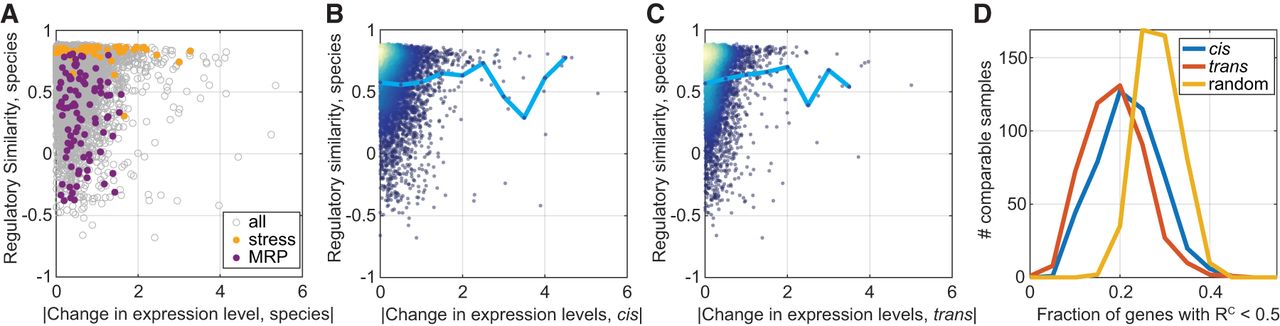
Variation in regulatory dynamics is distinct from variation in expression levels. (A) Regulatory similarity is independent of changes in expression level. Presented are between-species RC scores per gene as a function of the absolute of log2 fold change in expression level between species (median of the 462 comparable samples). Expression modules: stress induced and mitochondrial ribosomal proteins (MRP) are indicated in color. Modules were defined in Ihmels et al. (2002). The correlation between the measures is R = 0.011, P-value = 0.4. (B,C) Regulatory similarity is independent of cis and trans effects. Same as in A, presented are RC as a function of the median cis effect (B) or trans effect (C). Cyan line is the mean RC value per bin. The correlation coefficients between measures are R = −0.02, P-value = 0.17 (B), and R = 0.08, P-value < 1 × 10⁻¹⁰ (C). Color represents density. (D) Differentially expressed genes show a conserved regulatory similarity. We considered the top 100 cis- and trans-varying genes in expression level at each comparable sample and measured the fraction that shows low regulatory similarity (<0.5). Shown are the respective distributions compared to a control in which random genes were picked per comparable sample. ANOVA test for the three distributions result in P-value = 1 × 10−113, ANOVA test for the cis- and trans-distributions result in P-value = 1 × 10⁻¹². This analysis was repeated for different regulatory similarity thresholds as shown in Supplemental Figure S3B.


