
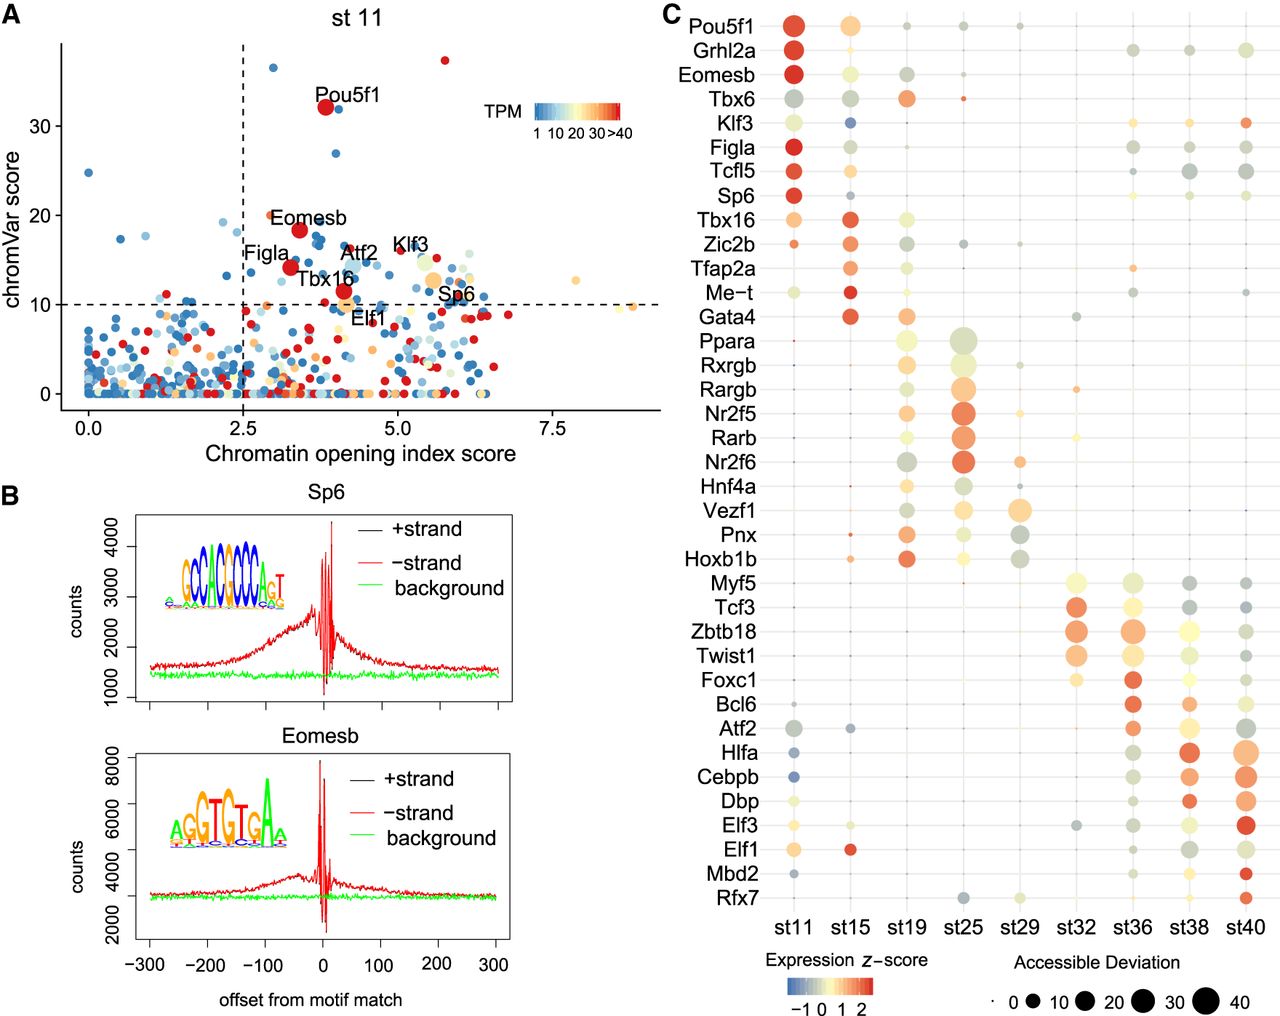
Trans-regulatory logic between genes and TFs. (A) Pioneer TF prediction at stage 11. Pioneer score is the x-axis, chromVAR score is the y-axis, and the expression level is represented by the color. Pioneer TFs are those dots with high scores of three measurements, plotted with larger size. (B) TF footprint of Sp6 and Eomesb. Within accessible elements, Tn5 insert counts suddenly drop around the given TF binding motif owing to the protection of that TF. (C) TF expression and enrichment of its binding motif. The size of the dots was correlated with accessible deviation calculated by chromVAR, indicating the enrichment of TF motifs. The color of the dots reflects the expression level of the given TF.


