
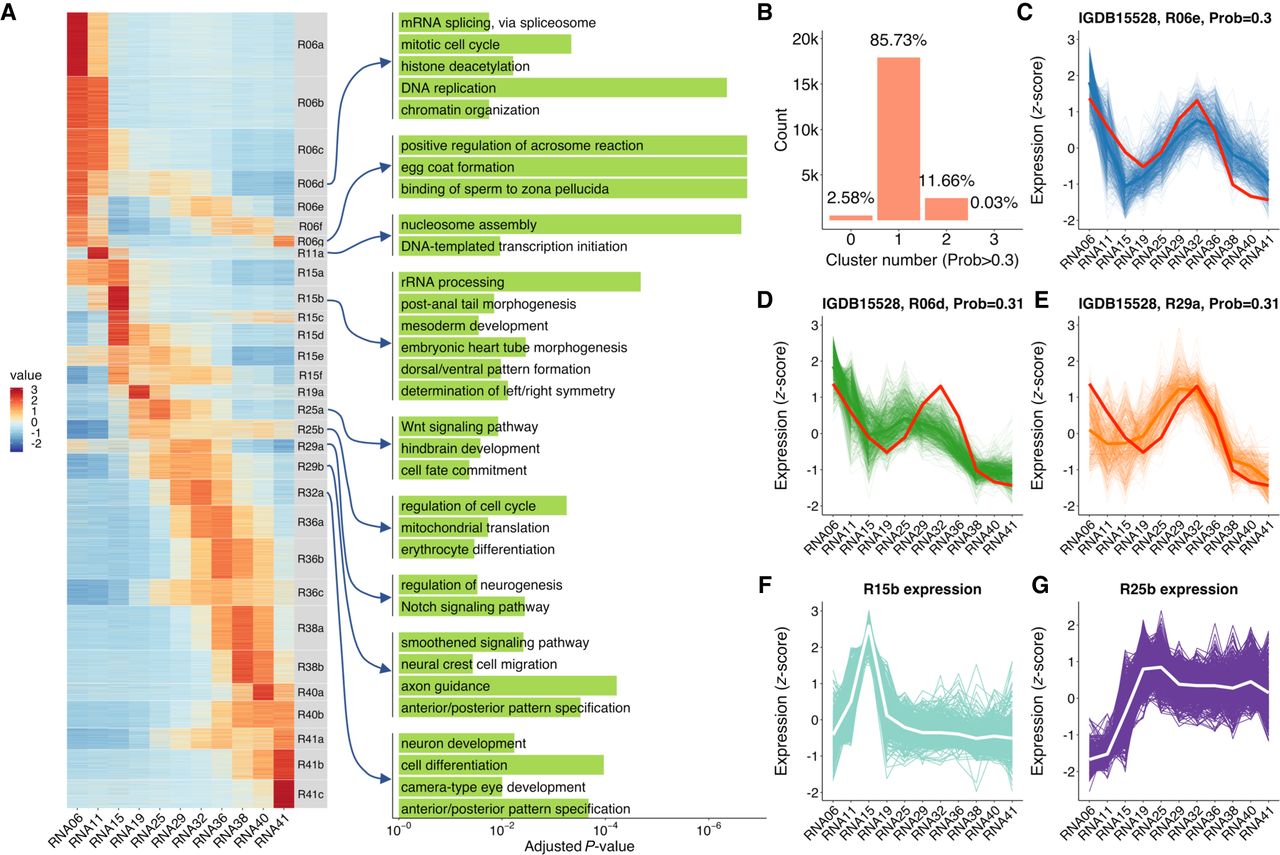
Clustering of expression profiles using a fuzzy clustering algorithm. (A) Heatmap of 30 expression profile clusters across embryogenesis. Genes expressed at >1 TPM in at least one stage are shown. Clusters were sorted by the stage when the maximum expression occurs. The bar plots on the right show selected GO enrichment of relevant clusters. (B) Adjustable fuzziness. With a cutoff of membership >0.3, 85.7% of genes were assigned to one cluster, 11.7% were assigned to two or more clusters, and 2.6% were not assigned to any cluster. (C–E) An example of one gene (rnf19a) assigned to three different clusters with membership >0.3, showing the similarity to multiple clusters. (F) Time-series expression profile of cluster R15b, which enriched mesoderm and body axis formation genes. The white line represents the average expression of the cluster, and the background lines represent all genes assigned to this cluster. (G) Time-series expression profile of cluster R25b, which enriched erythrocyte differentiation genes. The expression values were represented by TPM/z-score.


