
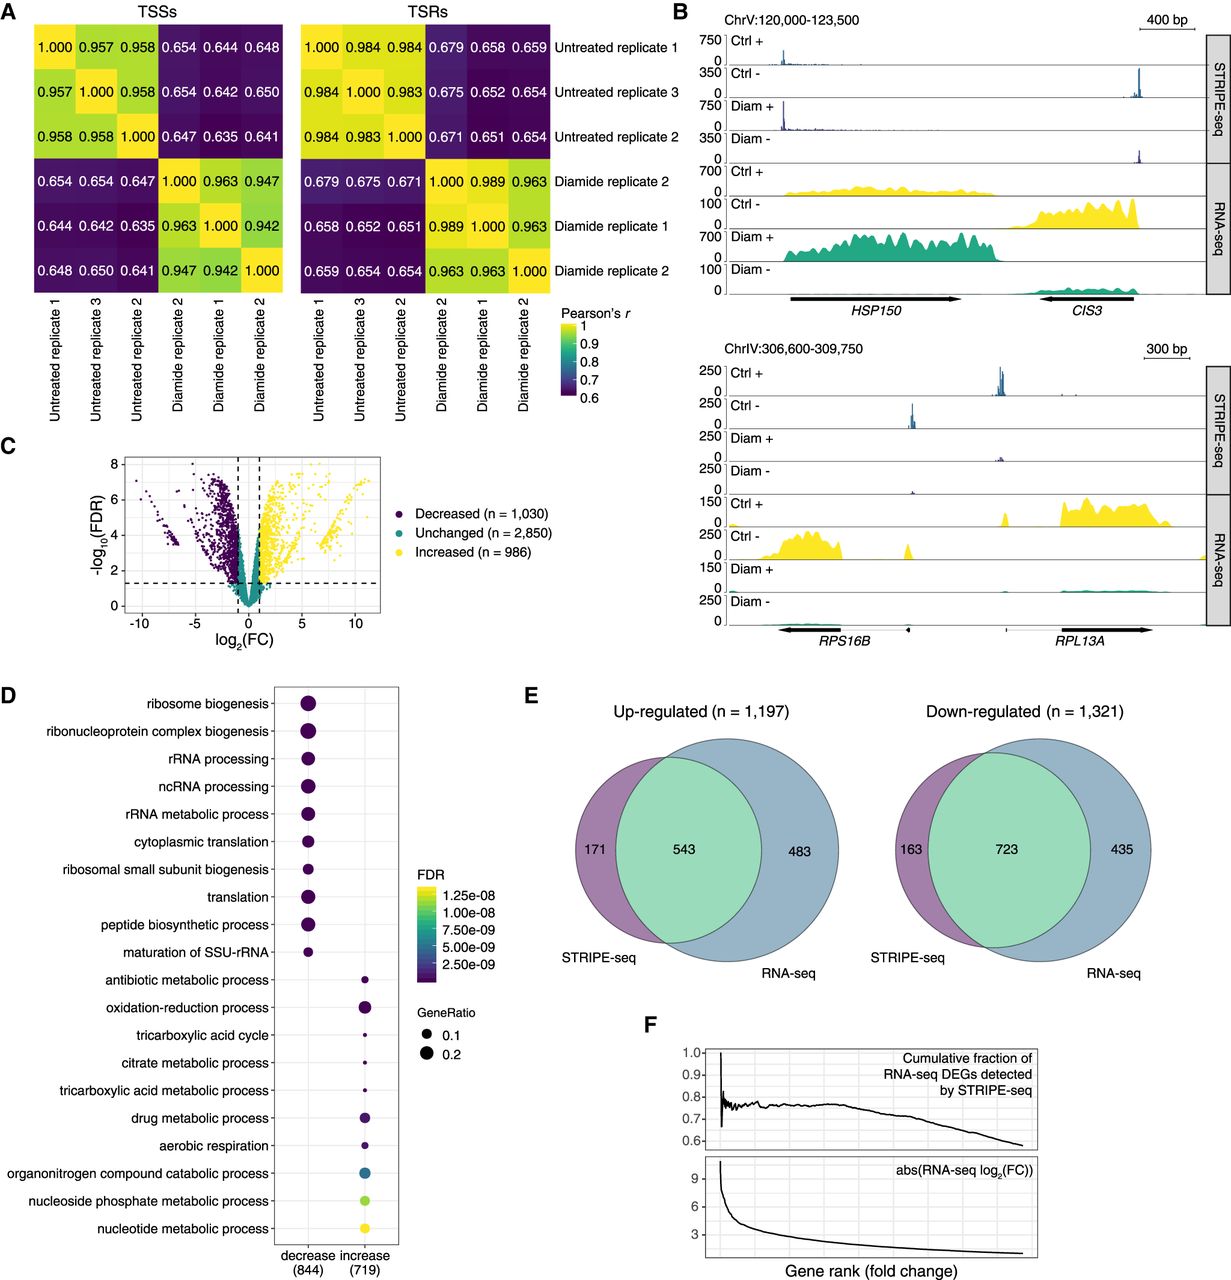
STRIPE-seq captures differential TSR usage and transcript abundance. (A) Hierarchically clustered heatmaps of Pearson's r values for pairwise comparisons between merged TSS and TSR sets from 100-ng control and diamide STRIPE-seq samples. (B) Genome browser-style tracks showing CPM-normalized STRIPE-seq and poly(A)+ RNA-seq from control and diamide-treated samples at two representative regions of the yeast genome. (C) Volcano plot of differential TSRs resulting from comparison of control and diamide-treated samples. (D) Dot plots of GO biological process terms for genes associated with TSRs that increased and decreased upon diamide treatment. (E) Venn diagrams of the overlap between DEGs identified by STRIPE-seq and RNA-seq in control and diamide-treated samples. (F) Cumulative distribution plots for fractions of DEGs captured by STRIPE-seq versus log2(FC) in poly(A)+ RNA-seq.


