
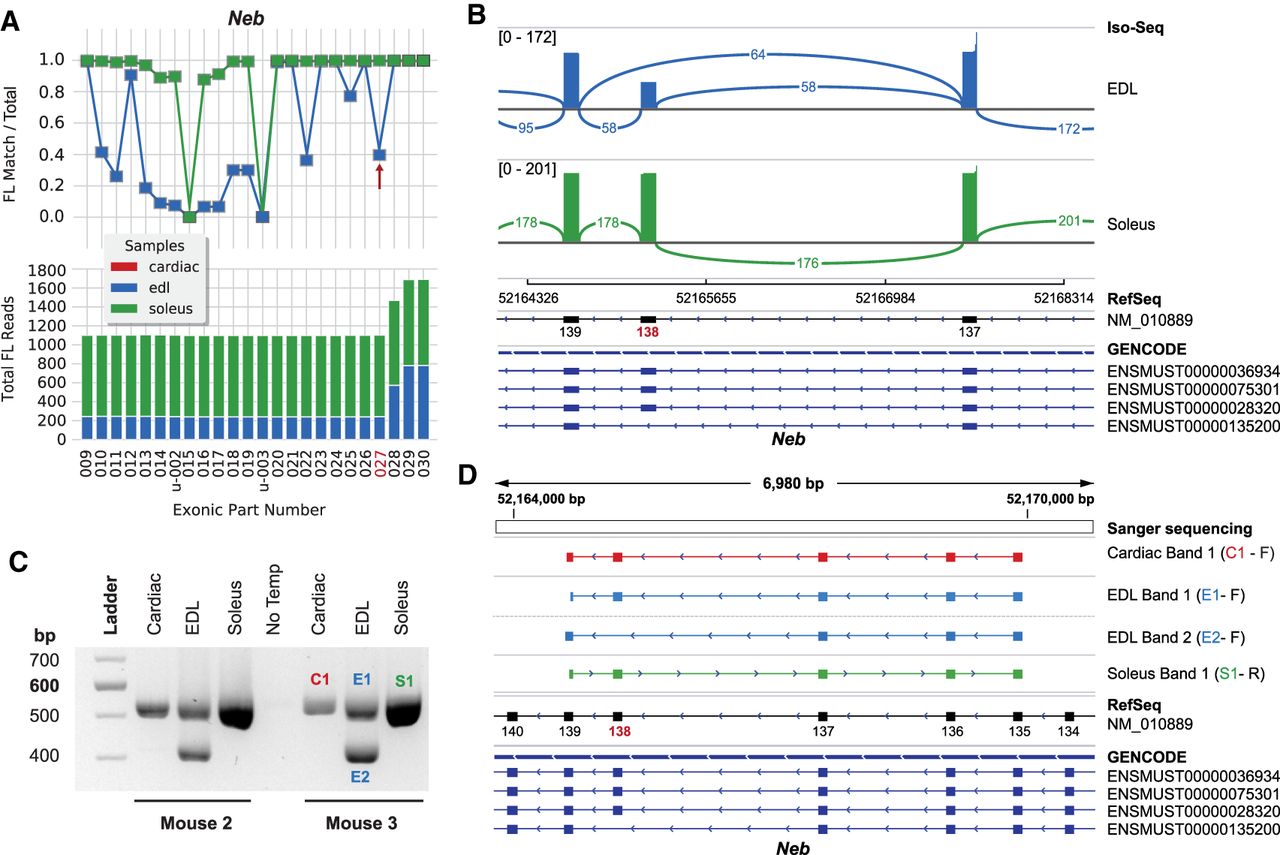
Differential usage of exon 138 of mouse nebulin. (A) Nebulin exon coverage graph (cropped) produced by exCOVator. (Bottom) Stacked bar graph displays full-length (FL) read coverage of exonic parts (EP). (Top) Line graph displays the ratio of [FL reads matching the EP/total FL reads] that overlap the EP coordinates. (B) Sashimi plot from the Integrative Genomics Viewer (IGV) displaying differential splicing of exon 138. The plot displays consensus reads from the BAM file (not FL reads). Minimum splice junction coverage = 5. (C) Agarose gel showing RT-PCR products pertaining to exon 138 from soleus, EDL, and heart. Primers target exon 135 and 139. Cardiac shows similar banding pattern as soleus; however, few reads were detected during sequencing. (D) Sanger sequencing of products cut from the gel seen in C. The top portion shows sequences aligned in IGV using the BLAT tool. Only the EDL band 2 is missing exon 138.


