
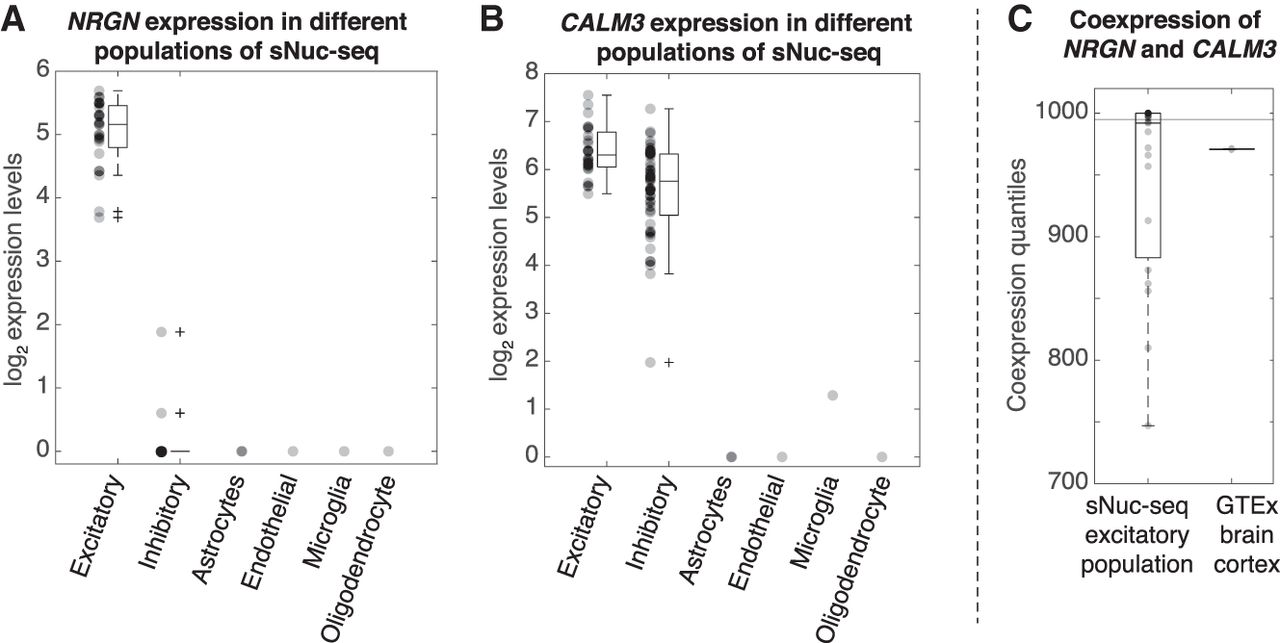
Figure 5.
Coexpression of NRGN and CALM3 in Excitatory cell types. (A) From sNuc-seq data: NRGN is only expressed in the Excitatory cell types. (B) From sNuc-seq data: CALM3 is expressed in both Inhibitory and Excitatory cell types. (C) The two genes are highly correlated in the Excitatory cell types—based on coexpression networks built from sNuc-seq data. They are correlated in the GTExBulk data set but do not meet the threshold for the network (threshold is marked by the red line; it is the 99.5 percentile).


