
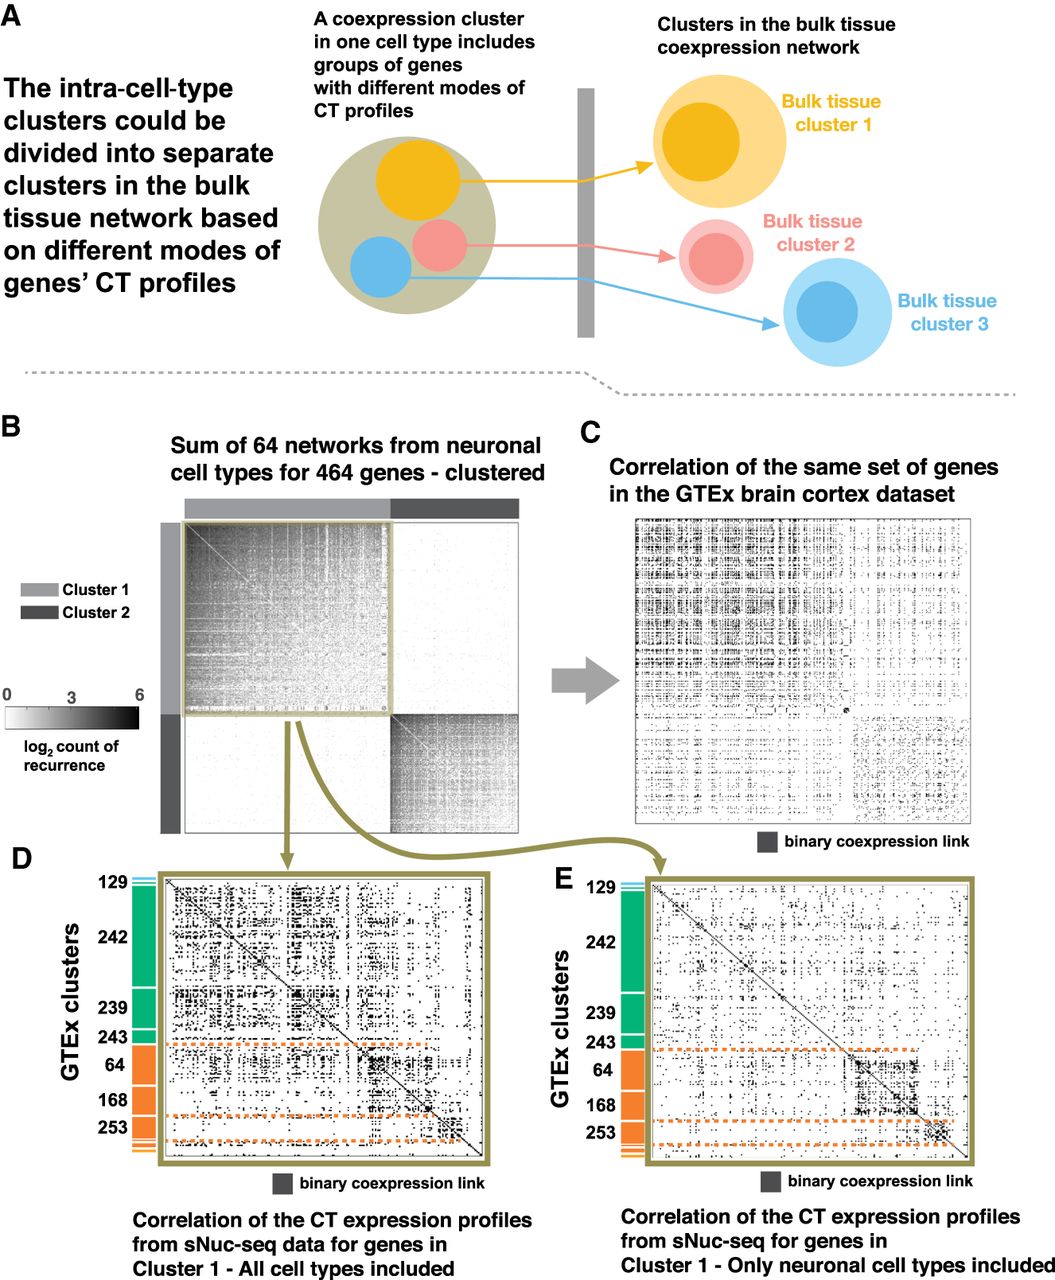
Modes of CT expression profiles shape gene clusters in the bulk tissue. (A) Schematic showing a coexpression cluster in a specific cell type could be divided into multiple clusters in the bulk tissue data set, as its genes might have different CT expression profiles. Each circle represents a group of genes. Blue, yellow, and coral represent different “modes” of CT expression profiles, similar to the mean CT expression profiles for the bulk tissue clusters in Figure 3. (B) The heat map shows part of the sum network from 64 neuronal sNuc-seq data sets where two coexpression clusters are identified. Clusters 1 and 2 (color bar gray and black) are well distinguished from each other. (C) Heat map showing the same set of genes with the same order in the GTExBulk coexpression network. Although the two clusters are somewhat distinguished, a great amount of inter-cluster links is present. (D) The heat map shows the network for the genes in Cluster 1, from the coexpression network built from the correlation of the CT expression profiles obtained from the 75 sNuc-seq data sets. Genes are ordered based on their belonging to different GTExBulk clusters, identified by the color bar and cluster IDs from Figure 3A. Three subclusters are mildly distinguished, separating two groups of housekeeping clusters from the Pyramidal clusters (orange vs. green). (E) Same plot as D, but the CT expression profiles are obtained from the 64 neuronal cell types only. The distinguished clusters demonstrate the group of genes with different expression levels in the neuronal cell types.


