
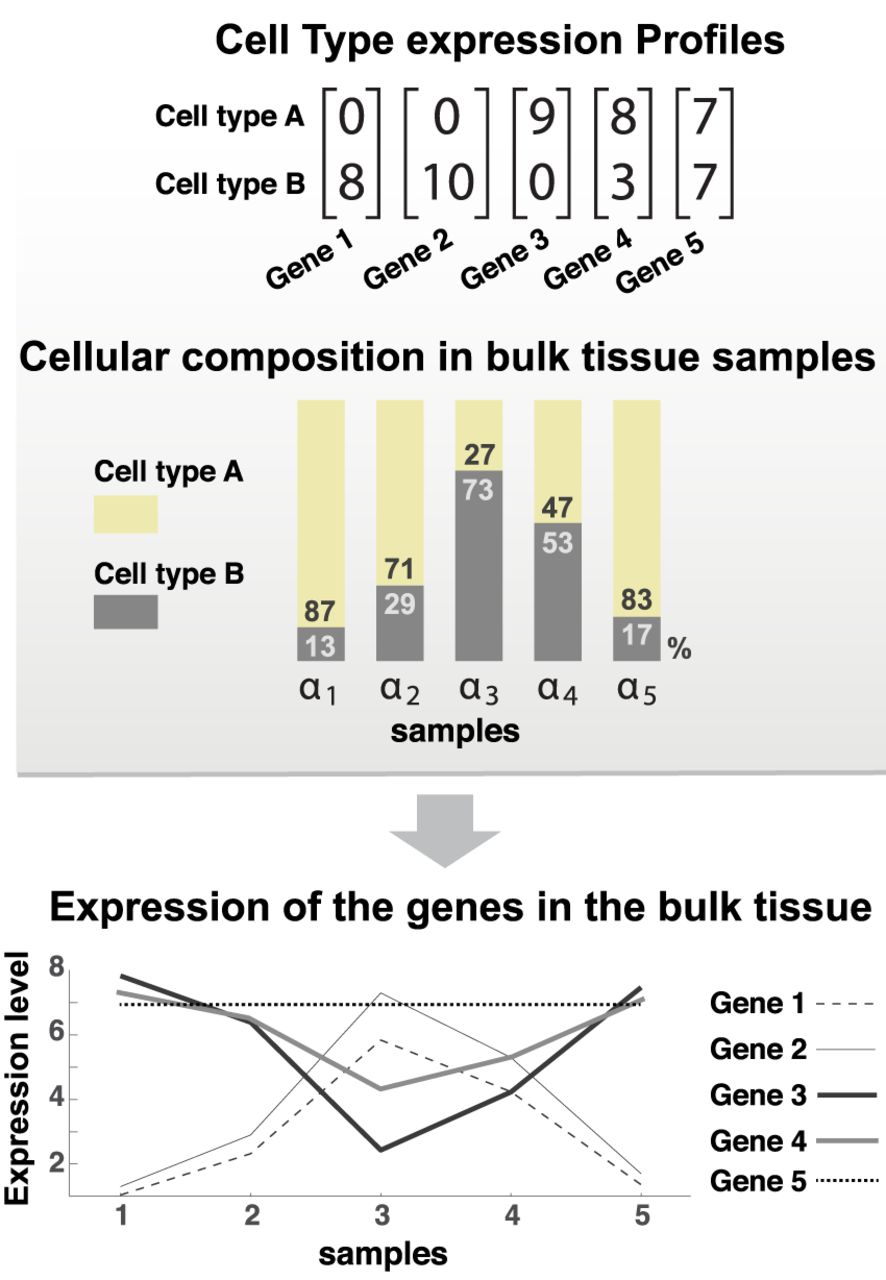
Schematic of cellular composition effects on gene expression variance in bulk tissue. Top: Cell type (CT) profiles for five genes in a hypothetical tissue with two cell types. Genes 1 and 2 are marker genes for cell type B. Gene 3 is a marker gene for cell type A. Gene 4 is expressed in both cell types but at different levels, whereas Gene 5 is expressed at equal levels. Middle: Hypothetical cellular compositions of five bulk tissue samples. Each sample αi has the same amount of biological material but different proportions of each cell type. Bottom: The expected observed expression levels. Genes 1 and 2 are positively correlated and negatively correlated with Genes 3 and 4. Gene 5 is expressed at the same level in all the bulk tissue samples as it is equally expressed in all cell types.


