
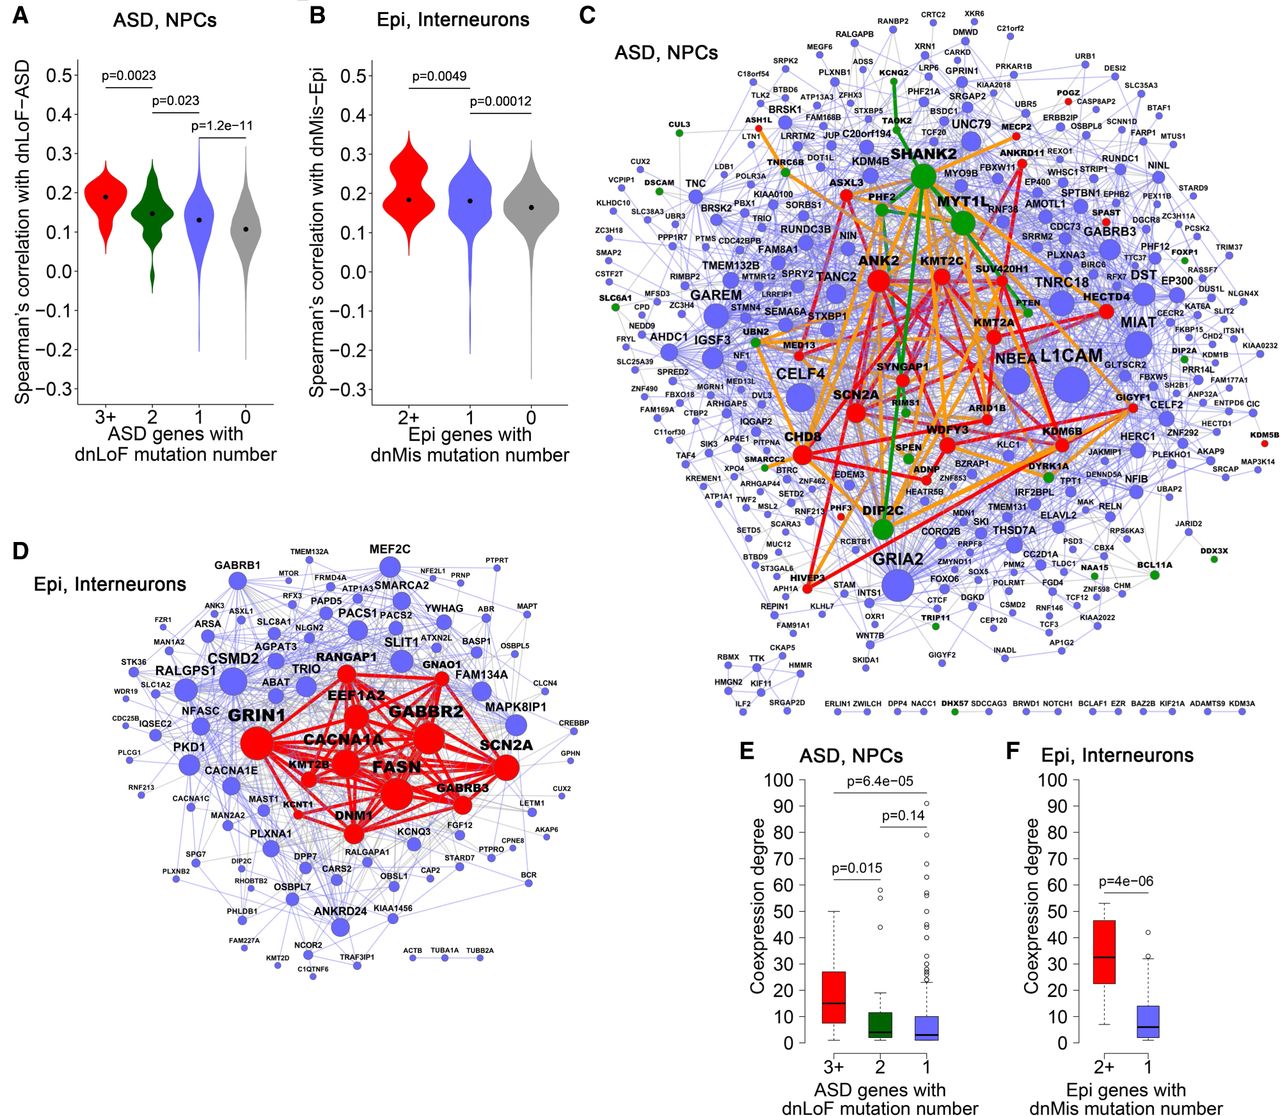
Coexpression network organization of ASD genes with dnLoF mutations in NPCs, and epilepsy genes with dnMis mutations in interneurons. (A) Spearman's correlation with dnLoF-ASD genes in NPCs for ASD genes with ≥3, 2, 1, and 0 dnLoF mutations. (B) Spearman's correlation with dnMis-Epi genes in interneurons for epilepsy genes with ≥2, 1, and 0 dnMis mutations. (C) Coexpression network of ASD genes with at least one dnLoF mutation in NPCs. Red, green, and blue nodes indicate ASD genes with ≥3, 2, and 1 dnLoF mutations, respectively. Red, green, and blue edges indicate coexpression within ASD genes with ≥3, 2, and 1 dnLoF mutations, respectively, and orange edges indicate coexpression between ASD genes with ≥3 dnLoF mutations and ASD genes with 2 dnLoF mutations. (D) Coexpression network of epilepsy genes with at least one dnMis mutation in interneurons. Red and blue nodes indicate epilepsy genes with ≥2 and 1 dnMis mutations, respectively. Red and blue edges indicate coexpression within epilepsy genes with ≥2 and 1 dnMis mutations, respectively. In C and D, node size is proportional to coexpression degree. (E) Coexpression degree in the NPC network of ASD genes with ≥3, 2, and 1 dnLoF mutations. (F) Coexpression degree in the interneuron network of epilepsy genes with ≥2 and 1 dnMis mutations. In A,B,E,F, P-values were calculated using the one-sided Wilcoxon rank-sum test.


