
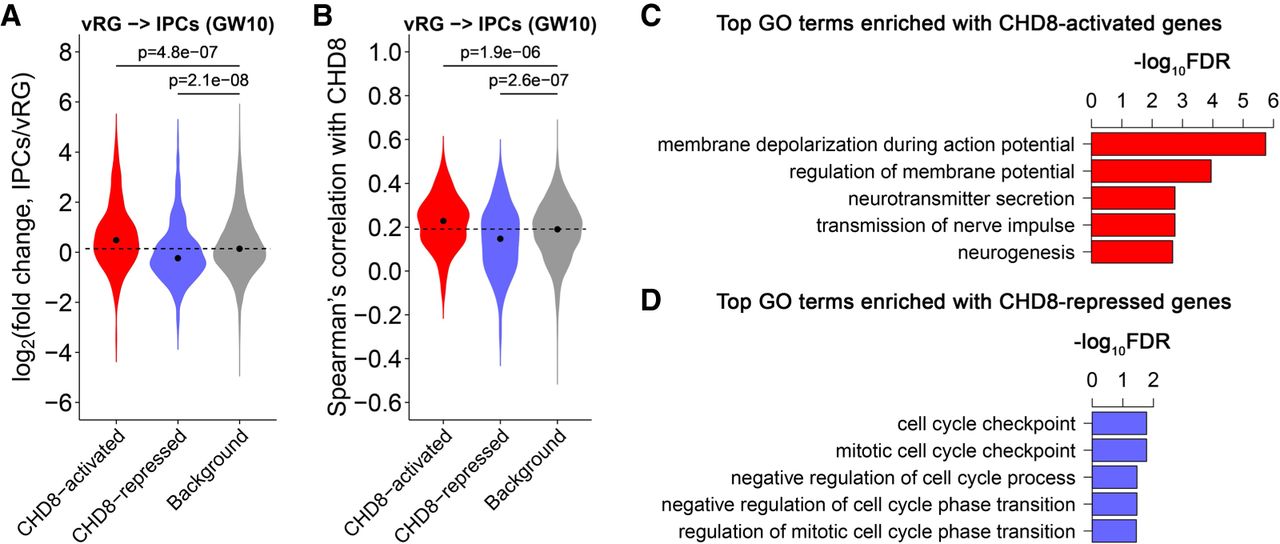
CHD8 target gene analysis. (A) Expression changes of CHD8-activated and CHD8-repressed genes during the transition from vRG cells to IPCs at GW10. The dashed horizontal line indicates the median log2(fold change) value of the background genes. P-values calculated by the one-sided Wilcoxon rank-sum test indicate whether CHD8-activated (-repressed) genes have higher (lower) log2(fold change) values than the background genes during the transition. (B) Spearman's correlation between CHD8-activated/CHD8-repressed genes and CHD8 during the transition. The dashed horizontal line indicates the median Spearman's correlation with CHD8 for the background genes. P-values calculated by the one-sided Wilcoxon rank-sum test indicate whether CHD8-activated (-repressed) genes have higher (lower) correlation with CHD8 than the background genes during the transition. (C,D) Top GO terms enriched with CHD8-activated (C) and CHD8-repressed genes (D).


