
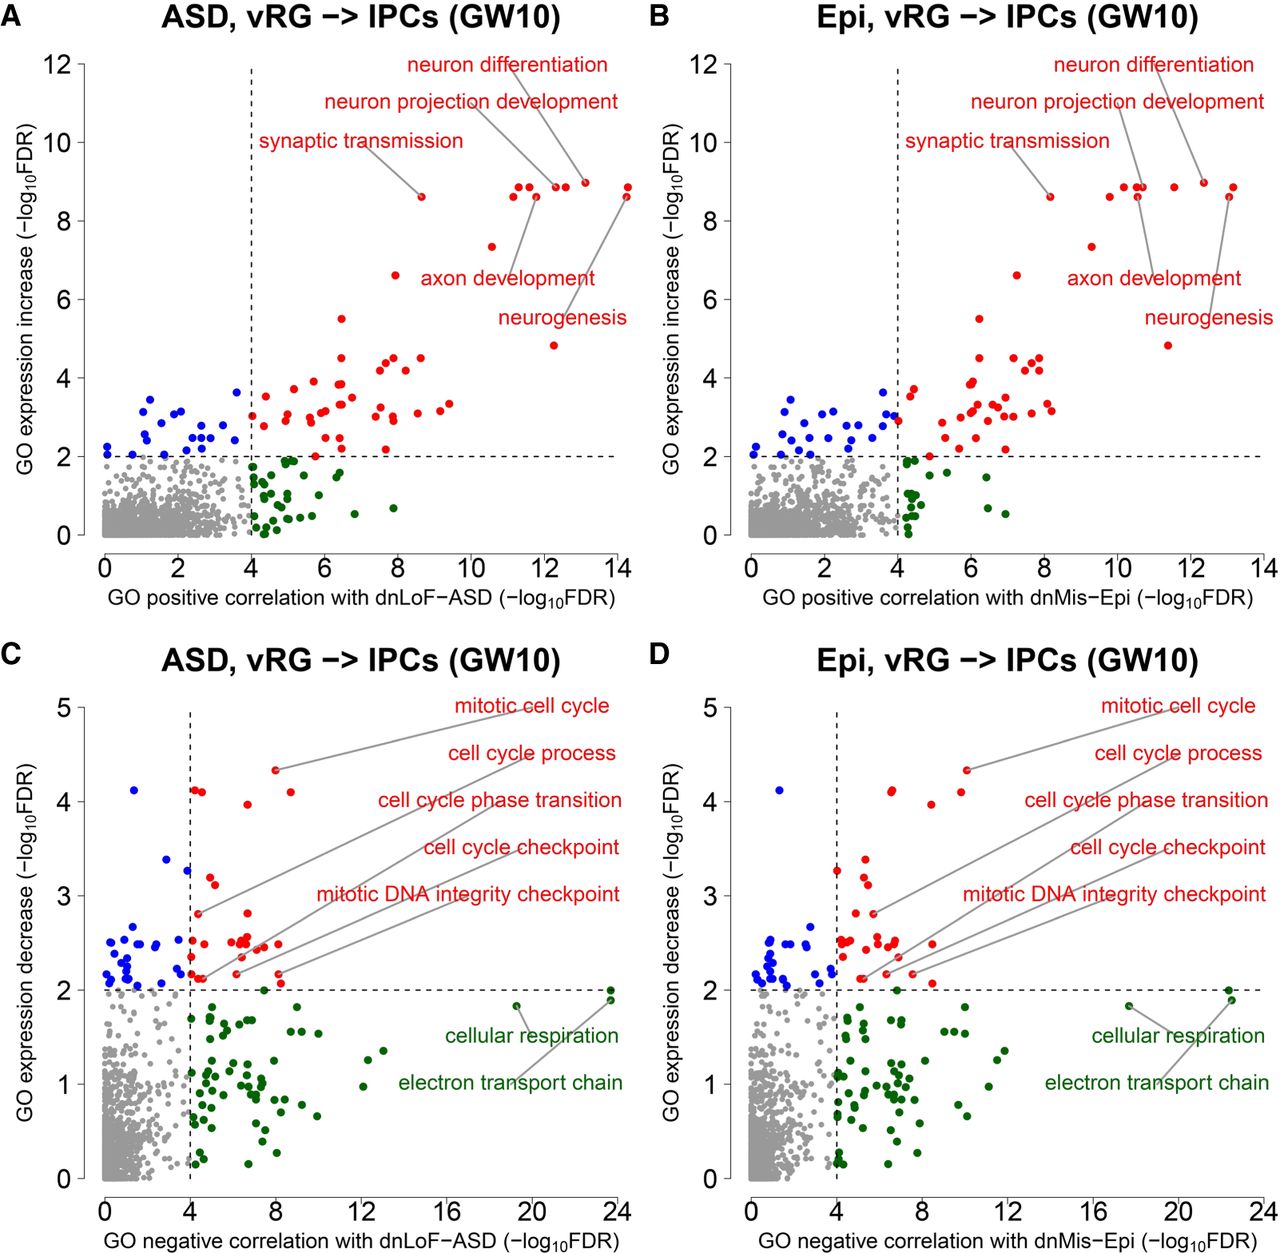
GO correlation analysis of dnLoF-ASD and dnMis-Epi genes and GO expression change analysis during the vRG-to-IPC transition at GW10. (A,B) Scatterplots show the significance values from GO positive correlation analysis of dnLoF-ASD (A) and dnMis-Epi genes (B) on the horizontal axis versus the significance values from GO expression increase analysis on the vertical axis during the transition. Dots represent individual GO biological process terms. Each dot has −log10FDR values on both the horizontal axis (how strongly genes annotated under a GO term positively correlate with dnLoF-ASD [A] and dnMis-Epi genes [B] during the transition) and the vertical axis (how much higher the log2[fold change] values are for genes annotated under the GO term compared to the background genes during the transition). The dashed vertical and horizontal lines indicate −log10FDR at 4 and 2 as significance thresholds. Red denotes GO terms significant in both analyses, green denotes GO terms significant only in GO positive correlation analysis, and blue denotes GO terms significant only in GO expression increase analysis. Selected representative GO terms are labeled. (C,D) Similar to A and B with GO negative correlation analysis of dnLoF-ASD (C) and dnMis-Epi genes (D) and GO expression decrease analysis during the transition.


