
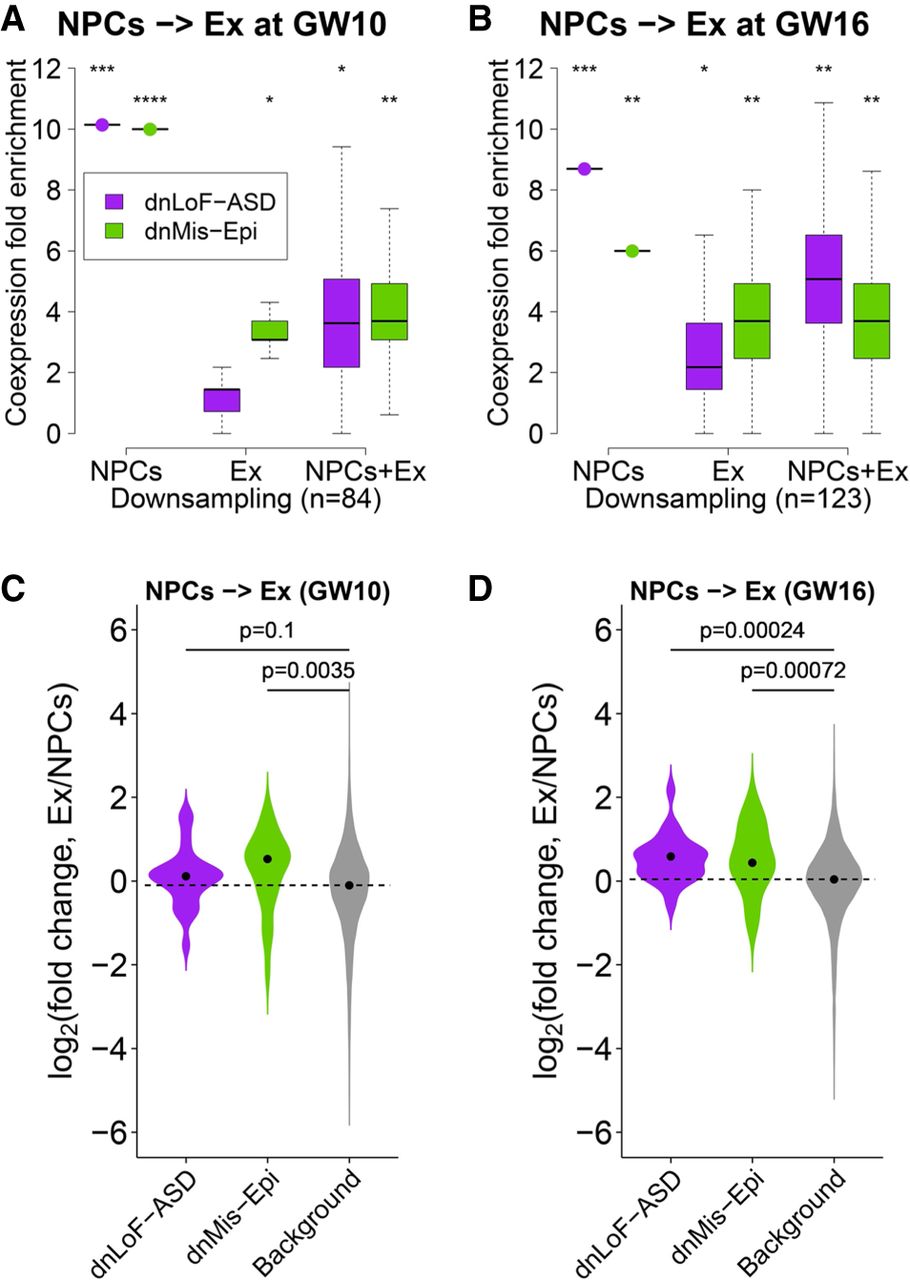
Coexpression enrichment analysis of dnLoF-ASD and dnMis-Epi genes during differentiation from NPCs to excitatory neurons (Ex). (A,B) Coexpression fold enrichment of dnLoF-ASD and dnMis-Epi genes in NPCs, excitatory neurons, and the differentiation at GW10 (A) and GW16 (B) by downsampling the same number of cells for each condition. Asterisks indicate −log10 P-values for differences in mean enrichment scores between the gene sets and the background genes (one-sided Fisher's exact test): (*) 1 ≤ −log10P < 2; (**) 2 ≤ −log10P < 5; (***) 5 ≤ −log10P < 10; (****) 10 ≤ −log10P. (C) Expression of dnMis-Epi but not dnLoF-ASD genes significantly increased during the differentiation from NPCs to excitatory neurons at GW10. (D) Expression of dnLoF-ASD and dnMis-Epi genes significantly increased during the differentiation from NPCs to excitatory neurons at GW16. In C and D, the dashed horizontal line indicates the median log2(fold change) value of the background genes.


