
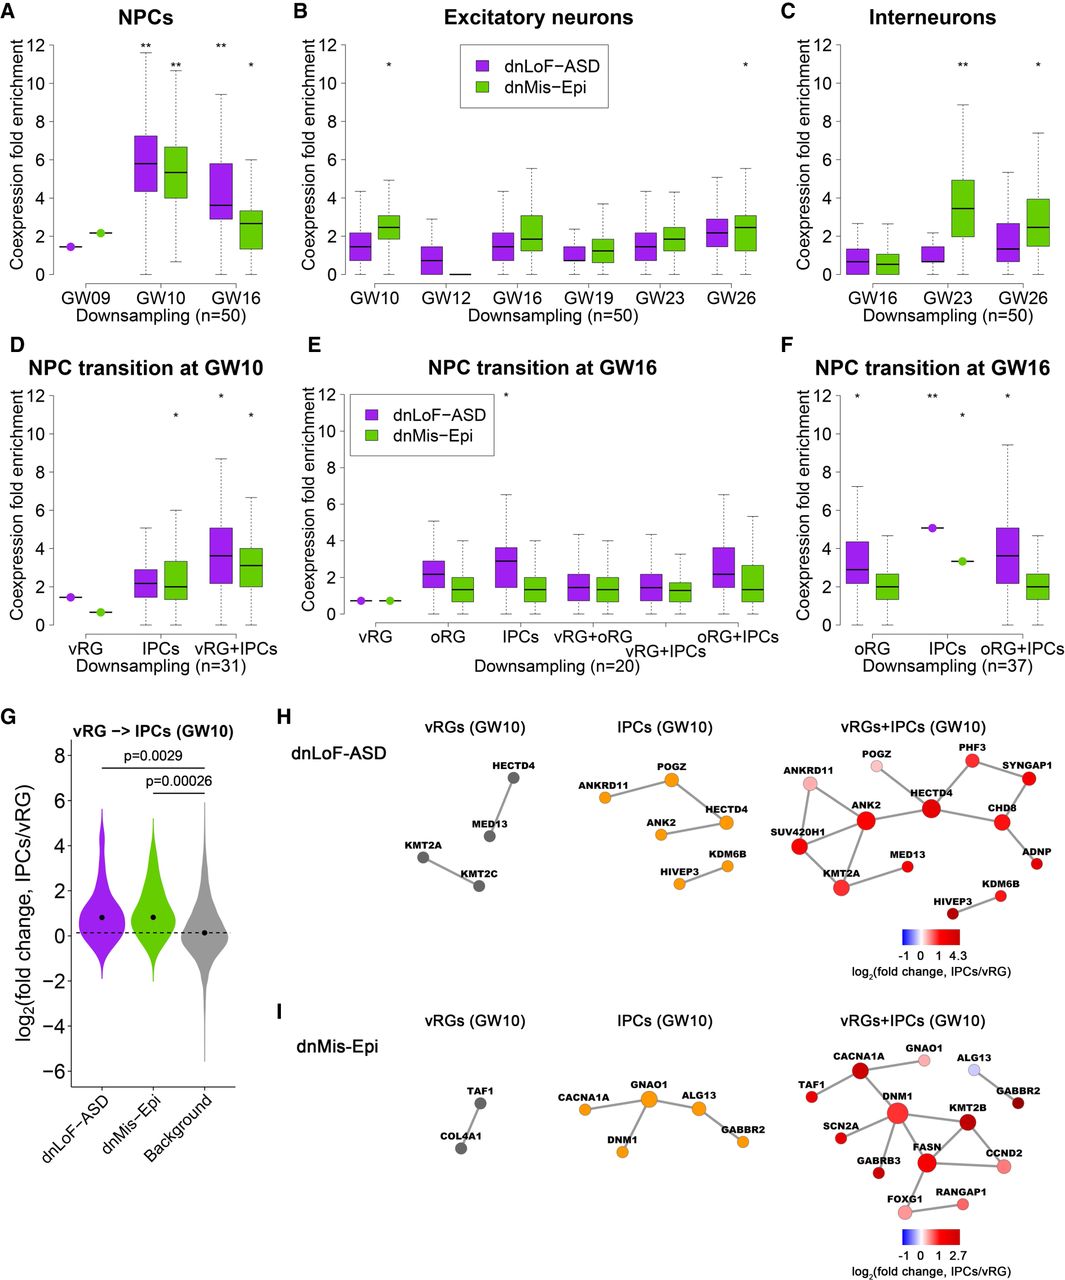
Coexpression enrichment analysis of dnLoF-ASD and dnMis-Epi genes during NPC and neuron development. (A–C) Coexpression fold enrichment of dnLoF-ASD and dnMis-Epi genes at specific stages of NPCs (A), excitatory neurons (B), and interneurons (C) by downsampling the same number of cells for each cell stage. (D) Coexpression fold enrichment of dnLoF-ASD and dnMis-Epi genes in vRG cells, IPCs, and the transition at GW10 by downsampling the same number of cells for each condition. (E,F) Coexpression fold enrichment of dnLoF-ASD and dnMis-Epi genes in vRG cells, oRG cells, IPCs, and their transitions at GW16 by downsampling 20 cells (E) and 37 cells (F) for each condition. In A–F, asterisks indicate −log10 P-values for differences in mean enrichment scores between the gene sets and the background genes (one-sided Fisher's exact test): (*) 1 ≤ −log10P < 2; (**) 2 ≤ −log10P < 5. (G) Expression of dnLoF-ASD and dnMis-Epi genes significantly increased during the transition from vRG cells to IPCs at GW10. The dashed horizontal line indicates the median log2(fold change) value of the background genes. P-values indicate differences between log2(fold change) values of dnLoF-ASD or dnMis-Epi genes and those of background genes during the transition (one-sided Wilcoxon rank-sum test). (H,I) Coexpression networks of dnLoF-ASD (H) and dnMis-Epi genes (I) in vRG cells, IPCs, and the transition at GW10 using original sample size. Node size is proportional to coexpression degree.


