
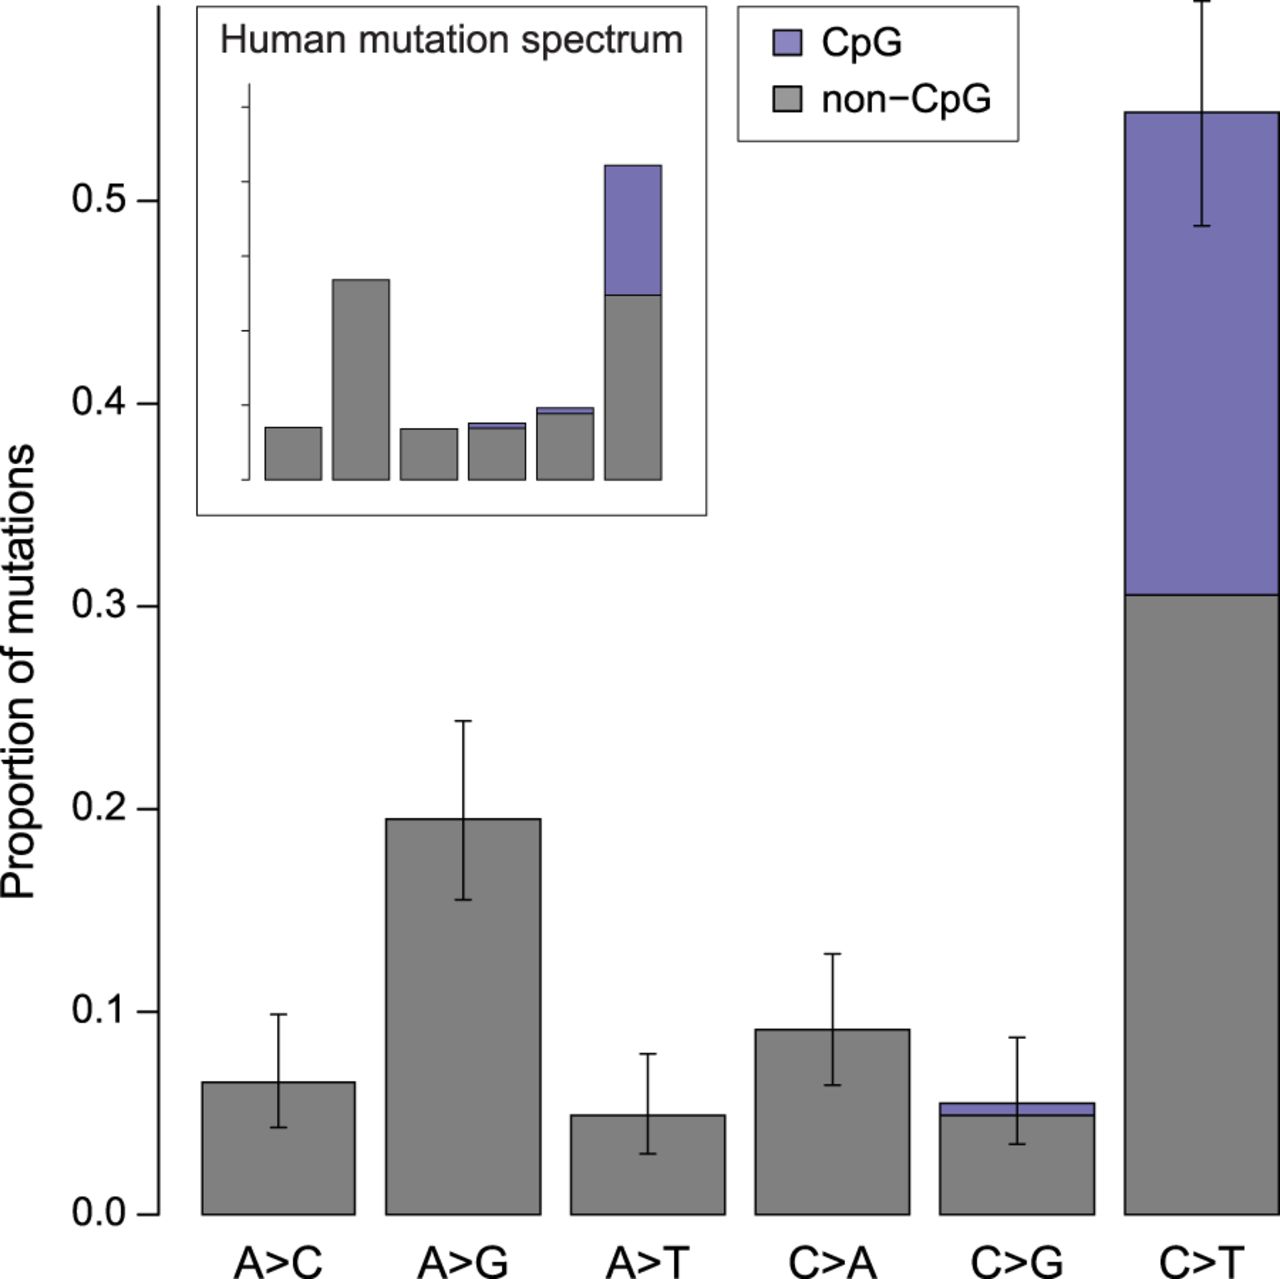
Figure 2.
Mutation spectrum in rhesus macaque. The frequency of each type of mutation from among the 307 identified. Error bars show binomial proportion 95% CI (Wilson score interval) for totals at each type. Mutations at CpG sites accounted for 24% of all mutations and represent 43% of all strong-to-weak transitions. Mutation categories represent their reverse complement as well.


