
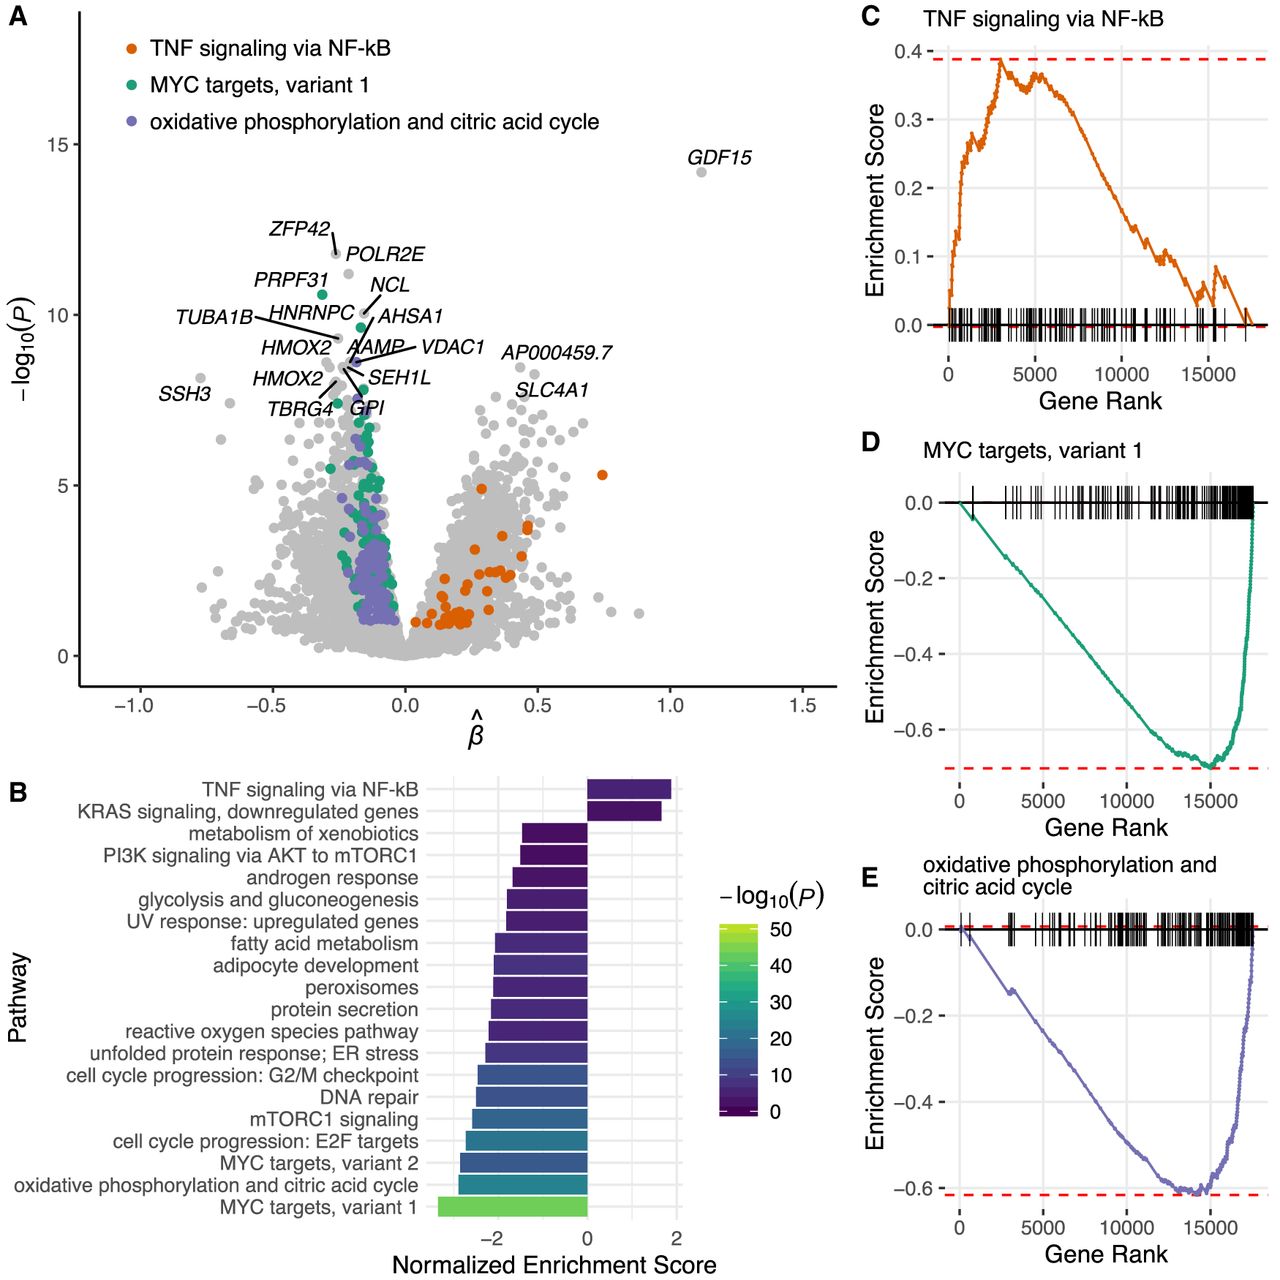
Transcriptional responses to aneuploidy in human embryos. (A) Volcano plot depicting differential expression between euploid and aneuploid cells. Positive values indicate increased expression in aneuploid cells, whereas negative values indicate reduced expression. (B) Hallmark gene sets from the Molecular Signatures Database (MSigDB) that are significantly enriched for genes that are up- or down-regulated in aneuploid cells based on gene set enrichment analysis (GSEA; 5% FDR). (C) Gene set enrichment plot demonstrating that genes regulated by NF-kB in response to tumor necrosis factor are significantly up-regulated in aneuploid cells. (D) Same as panel C, but demonstrating that MYC targets exhibit reduced expression in aneuploid cells. (E) Same as panel C, but demonstrating that genes involved in oxidative phosphorylation are down-regulated in aneuploid cells.


