
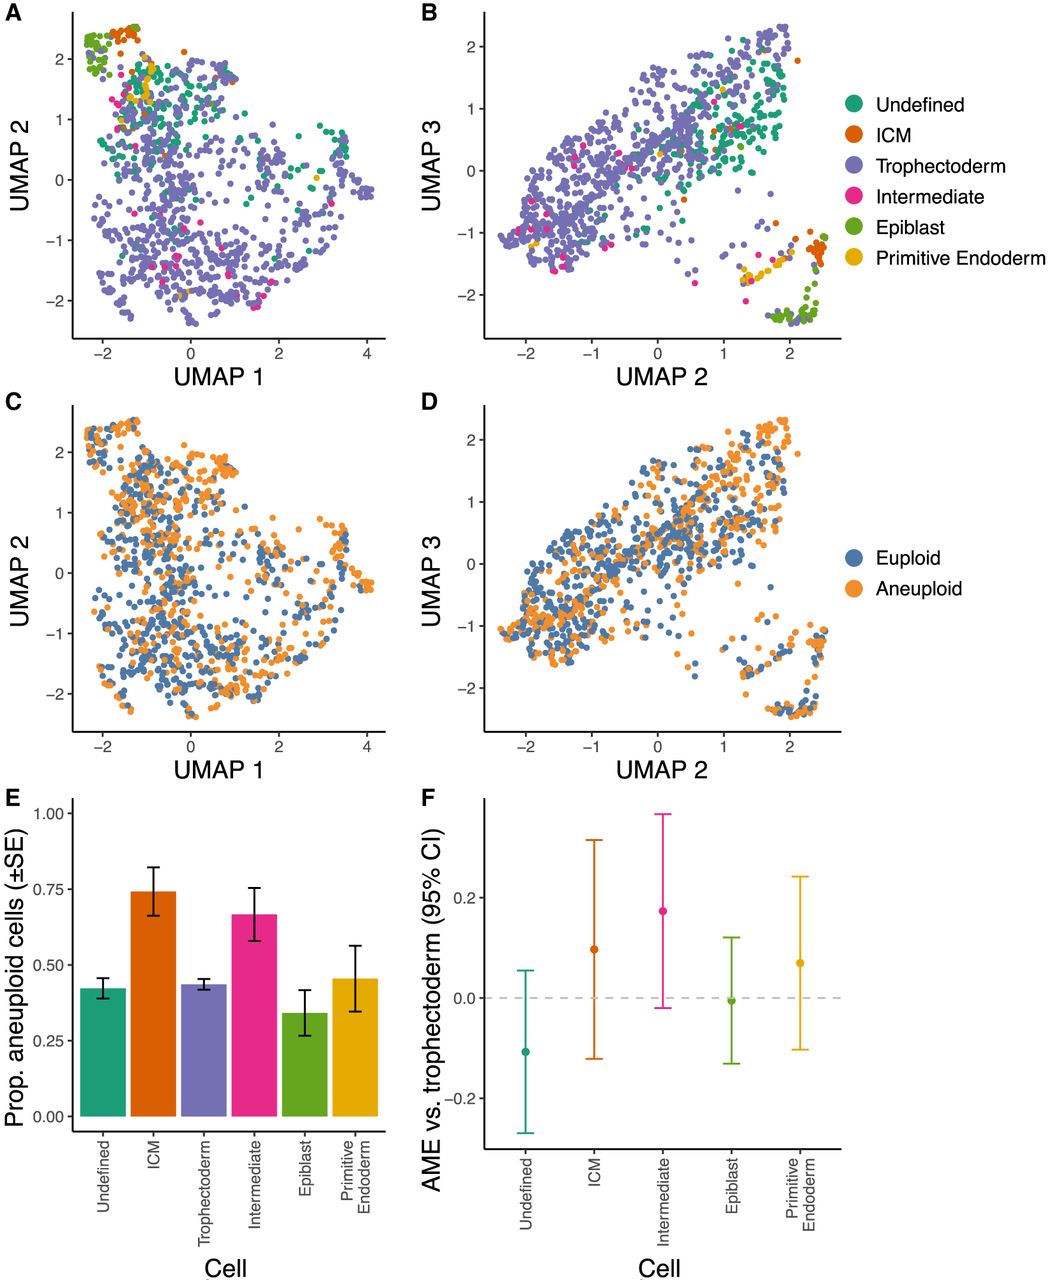
Comparisons of aneuploidy across cell types. (A) Individual cells plotted on the first and second UMAP dimensions, colored by cell type annotations from Stirparo et al. (2018). (B) Same as panel A, but for the second and third UMAP dimensions. (C) Cells plotted on the first and second UMAP dimensions, colored by aneuploidy status. (D) Same as panel C, but for the second and third UMAP dimensions. (E) Proportions of aneuploid cells, stratified by cell type. (F) Average marginal effects (AME) of cell types on aneuploidy rates relative to aneuploidy rates of trophectoderm cells—the source for PGT-A biopsies. Confidence intervals of all estimates overlap zero, indicating no significant difference for any cell type.


