
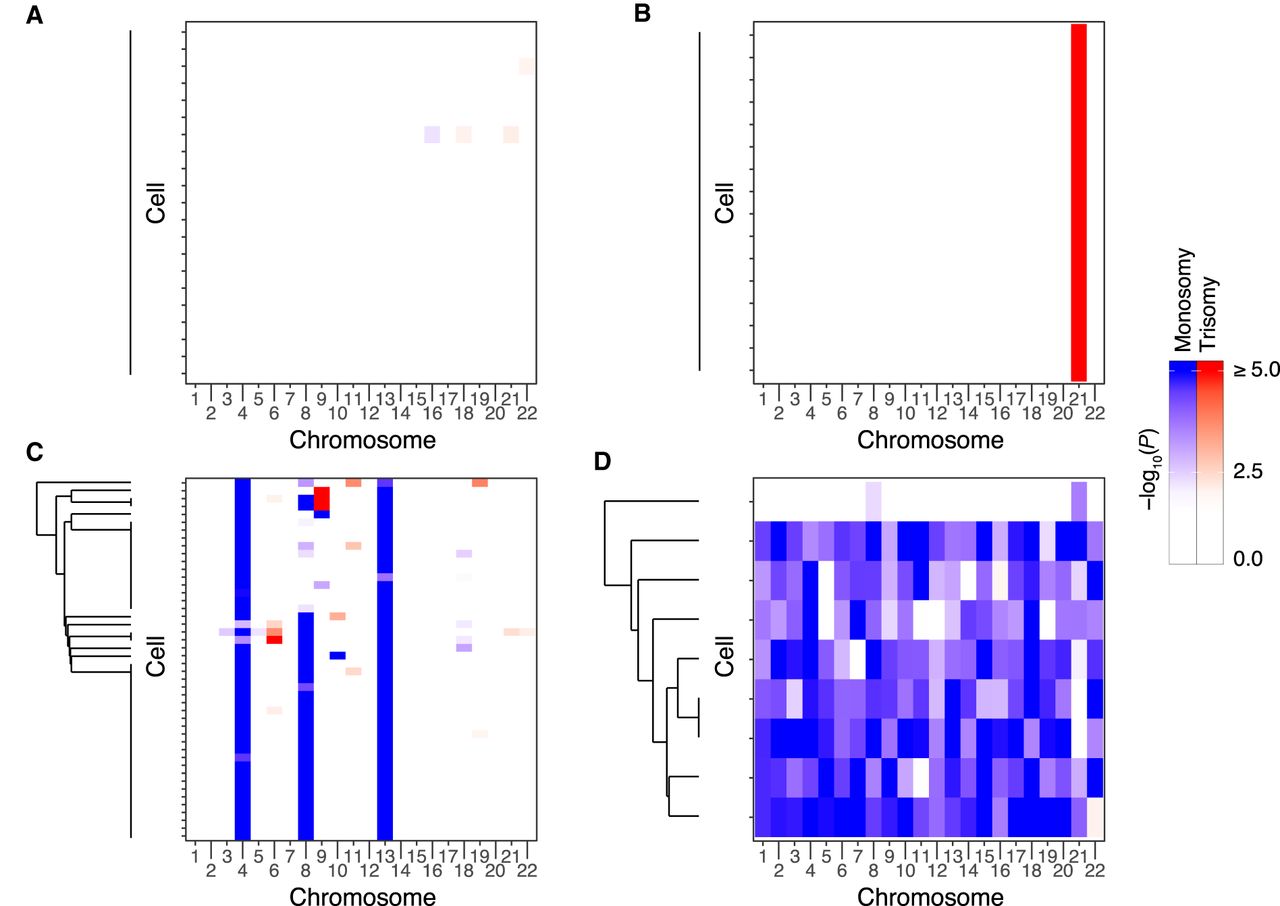
Examples of chromosome abnormalities detected based on scRNA-seq data from human embryos. Each heat map represents data from an individual embryo. Rows of the heat maps represent single cells, whereas columns represent chromosomes (autosomes only). Dendrograms depict hierarchical clustering of aneuploidy signatures, roughly reflecting common ancestry among aneuploid cells. (A) Embryo E7.3 was called euploid with negligible deviations from the null observed for all chromosomes within all cells. (B) Embryo E5.13 exhibits a putative meiotic-origin trisomy of Chromosome 21. (C) Embryo E7.17 exhibits putative meiotic-origin monosomies of Chromosomes 4 and 13, mosaic monosomy of Chromosome 8, and sporadic low-level aneuploidies of other chromosomes. (D) Embryo E7.5 was inferred as mosaic near-haploid, with haploid or near-haploid signatures in eight of nine cells, but near-diploidy in one cell.


