
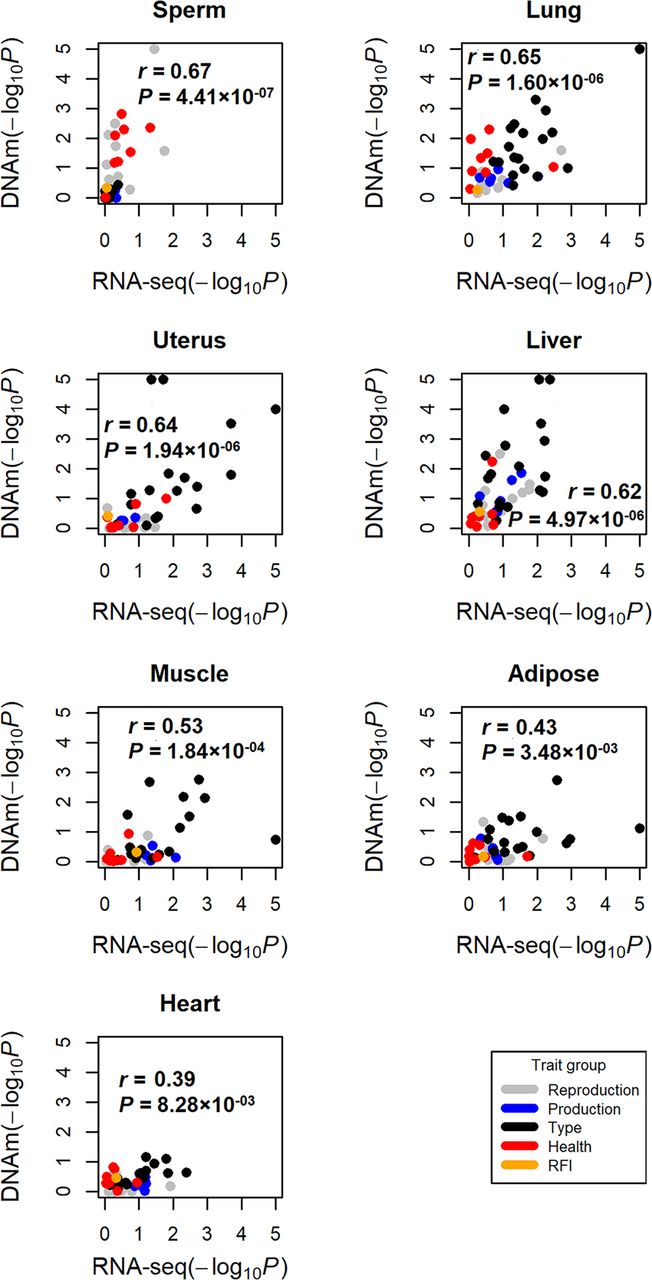
Figure 4.
Validation of trait-tissue associations using DNA methylation data across seven tissues. Each dot represents a trait. The y-axis is for GWAS signal enrichments (−log10P) obtained using tissue-specific DNA methylated regions, whereas the x-axis is for GWAS signal enrichments obtained using tissue-specific expressed genes. The r is for Pearson's correlation.


