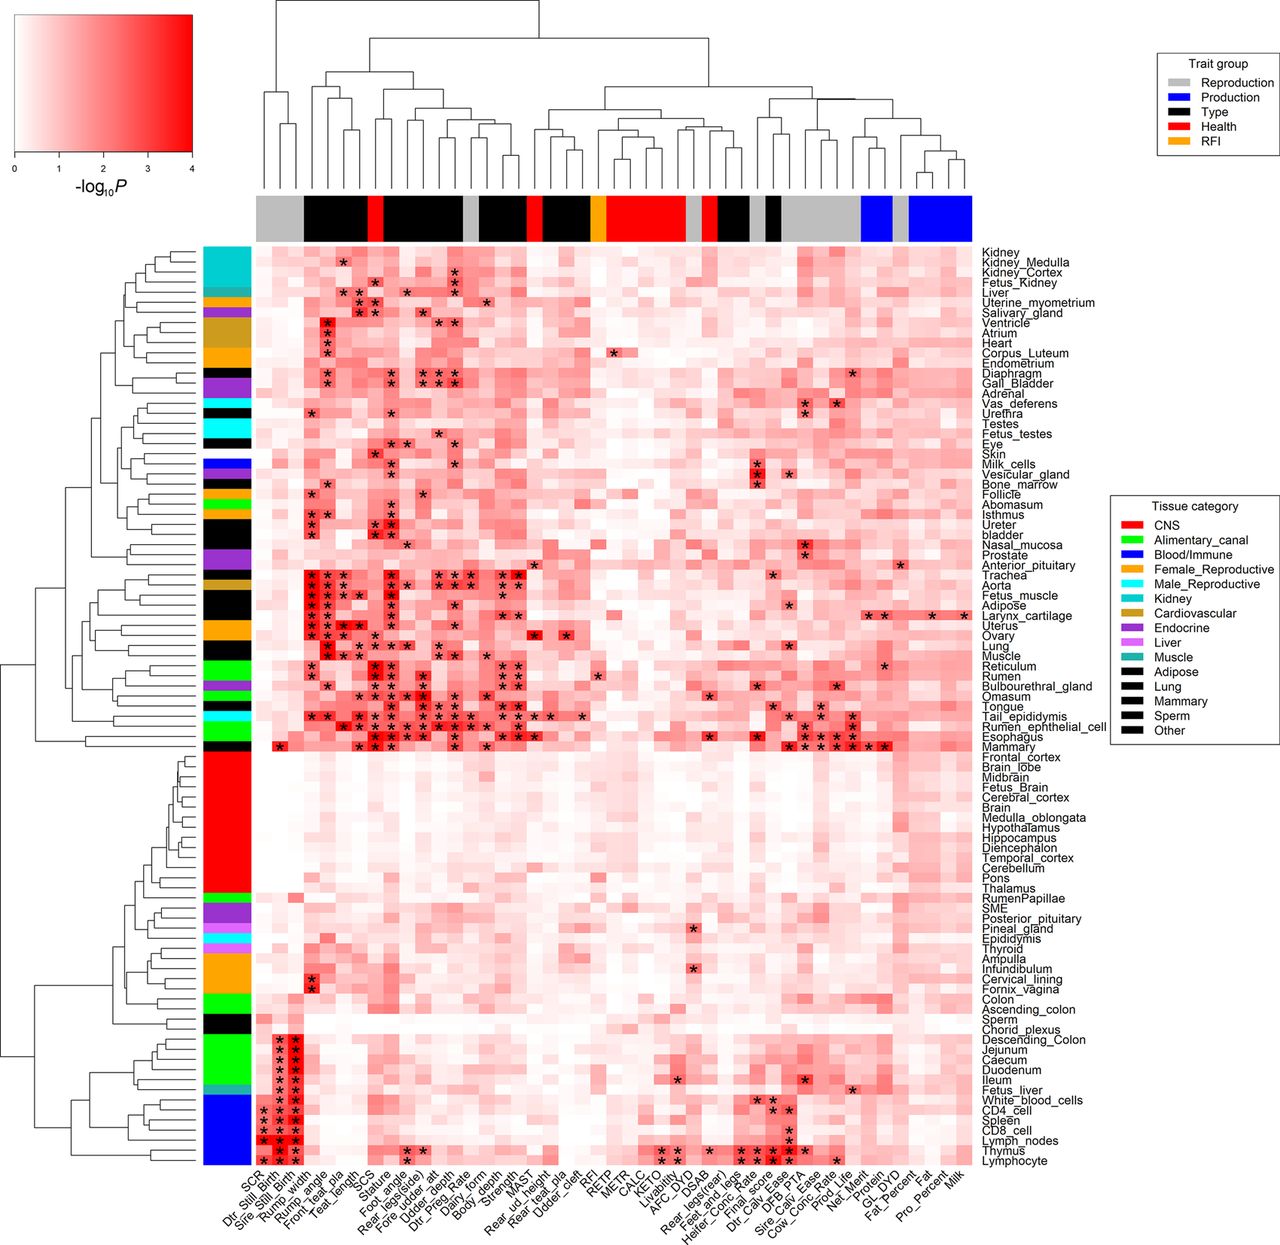
Comprehensive analyses of 723 transcriptomes enhance genetic and biological interpretations for complex traits in cattle

(Downloading may take up to 30 seconds. If the slide opens in your browser, select File -> Save As to save it.)

Click on image to view larger version.

Figure 3.
Figure 3.

The relationships between 45 complex traits and 91 tissues and cell types. The color corresponds to enrichment degrees (i.e., −log10P) that are computed using a sum-based GWAS signal enrichment analysis based on the top 5% tissue-specific genes and a 50-kb extension. (*) Corrected-P (FDR) < 0.1.

This Article

  1. Genome Res. 30: 790-801

Preprint Server