
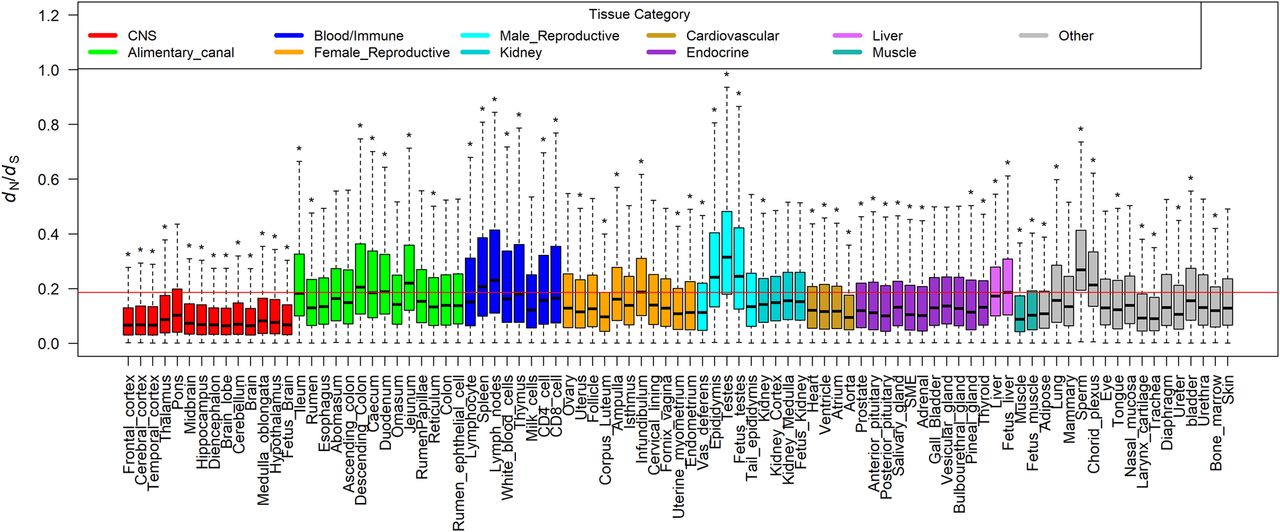
Figure 2.
Comparison of dN/dS ratios of tissue-specific genes across all the 91 tissues and cell types between human and cattle. The red line represents the averaged dN/dS ratio of all orthologous genes between human and cattle. For each tissue, we compared tissue-specific genes of this tissue against the remaining genes using a two-tailed t-test; (*) P < 0.01.


