
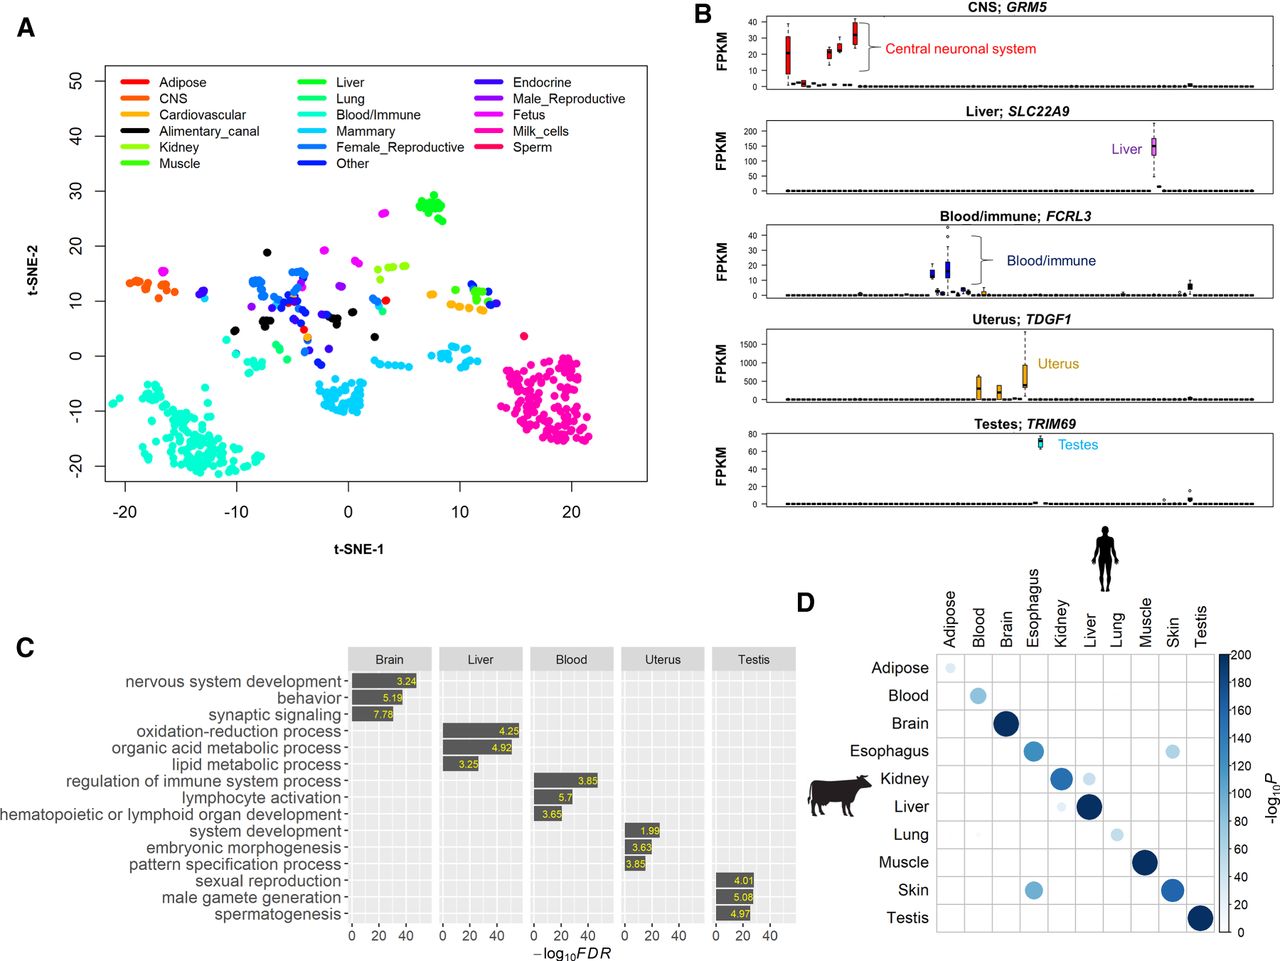
General characteristics of the cattle gene atlas. (A) Clustering analysis of all 723 RNA-seq samples using t-SNE (t-Distributed Stochastic Neighbor Embedding) procedure. (CNS) Central neural system. (B) Examples of tissue-specific genes in brain (GRM5), liver (SLC22A9), white blood cells (FCRL3), uterus (TDGF1), and testes (TRIM9). The y-axis is the raw gene expression, that is, fragments per kilobase per million mapped reads (FPKM). (C) Gene Ontology enrichment analysis of tissue-specific genes (the top 5% of genes based on t-statistics). The value in each bar is the fold of enrichment. (D) The enrichment analysis of cattle tissue-specific genes with human tissue-specific genes. The P-value is obtained using a hypergeometric test.


