
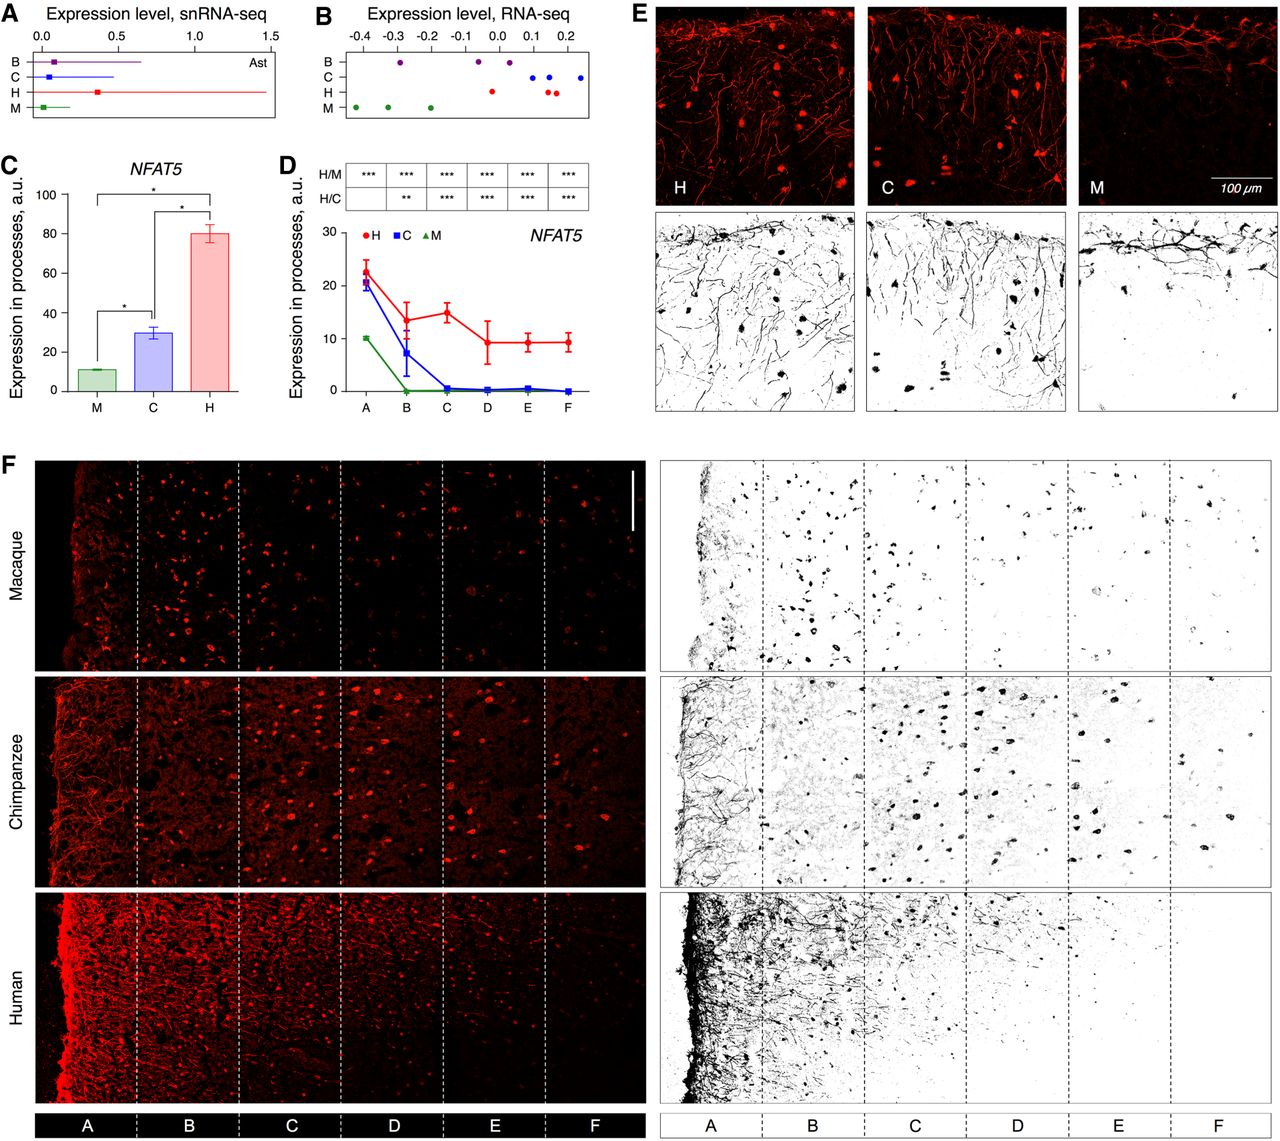
Gene expression differences detected by IHC. (A) The mean log10-transformed expression level of NFAT5 mRNA in AC astrocytes (squares), and the standard deviation of the mean (horizontal lines). (B) The log10-transformed read counts normalized for the median of NFAT5 mRNA in bulk AC data. Circles indicate individual samples. Average fluorescent intensities of NFAT5 IHC signal in the astrocytic processes of macaques, chimpanzees, and humans across cortical layers (C) and at different cortical depth (D). Error bars show the standard deviation of the mean. (***) P < 0.0005; (**) P < 0.005; (*) P < 0.05, two-sided t-test, Holm-Sidak correction; (H/C) human-chimpanzee comparison; (H/M) human-macaque comparison. Symbols indicate cortical sections located at increasing depth, depicted in panel F. (E) IHC (upper) and its binarized representation (lower) of NFAT5 protein in the uppermost layer of AC sections. (F) Immunostaining (left) and its binarized representation (right) of NFAT5 protein in the three upper layers of AC sections in macaques, chimpanzees, and humans (for GFAP and DAPI staining of these sections, see also Supplemental Figs. S45–S49). Sections A–F indicate segmentation areas used in the analysis presented in panel D. (Scale bar) 100 µm.


