
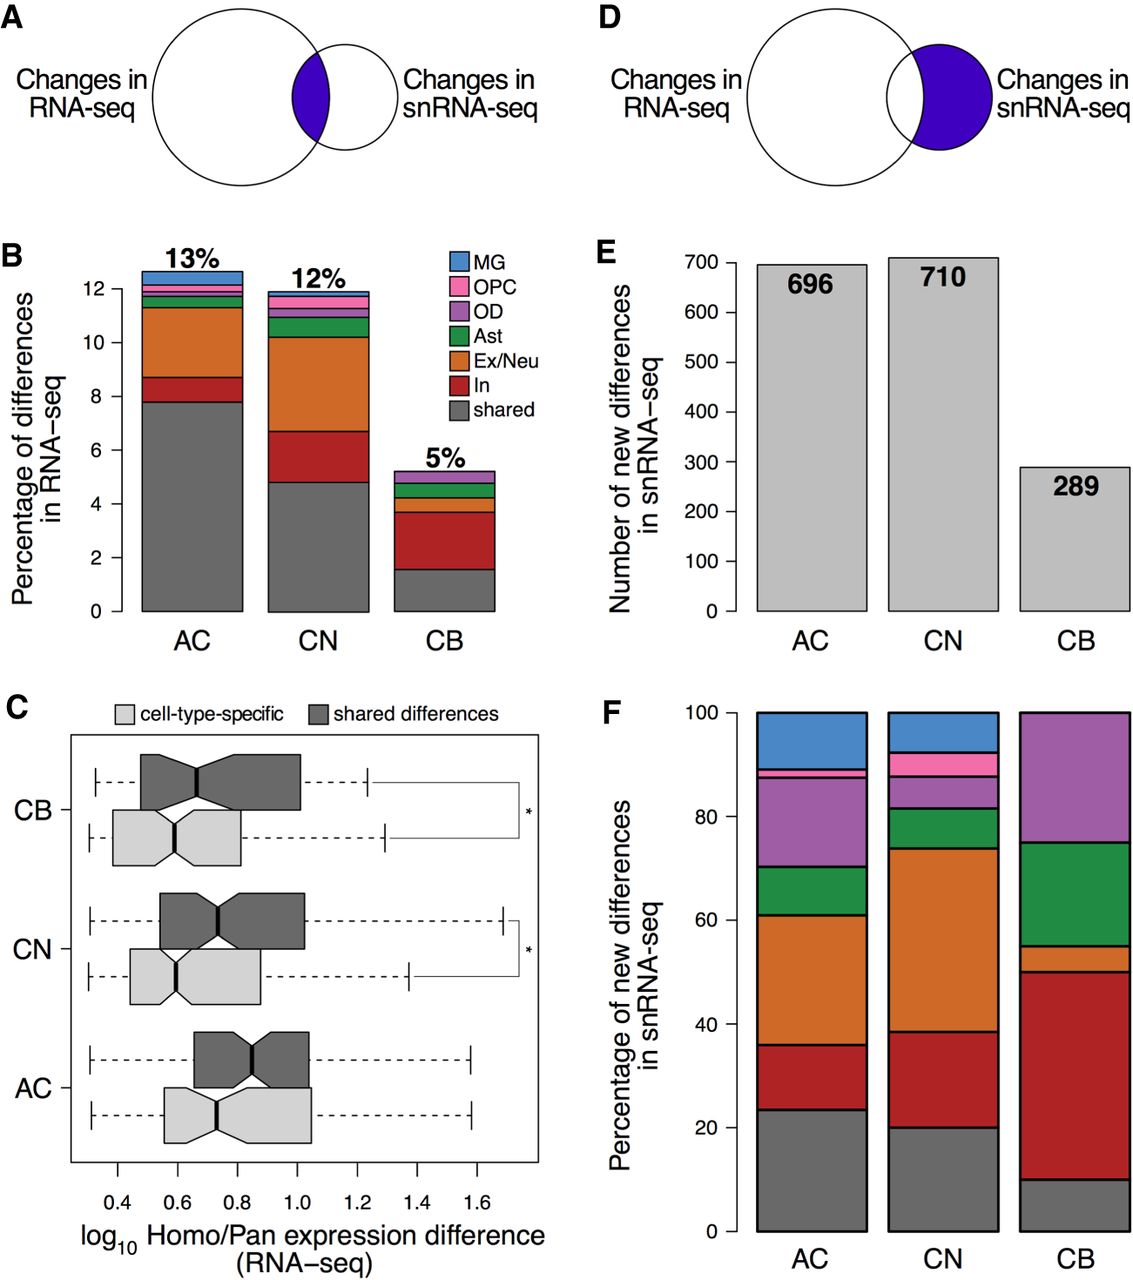
Figure 6.
Gene expression differences detected by snRNA-seq and bulk RNA-seq. (A) Schematic representation and (B) percentage and the cell type specificity of the expression differences present in bulk RNA-seq and snRNA-seq, defined as absolute greater than twofold difference in human samples compared to a pool of chimpanzee and bonobo samples (Methods). (C) The amplitude of expression differences detected in one (specific) or multiple (shared) cell types in bulk RNA-seq. (*) P < 0.05, one-sided t-test. (D) Schematic representation, (E) numbers, and (F) cell type specificity of the expression differences solely detected by snRNA-seq. Color as in A.


