
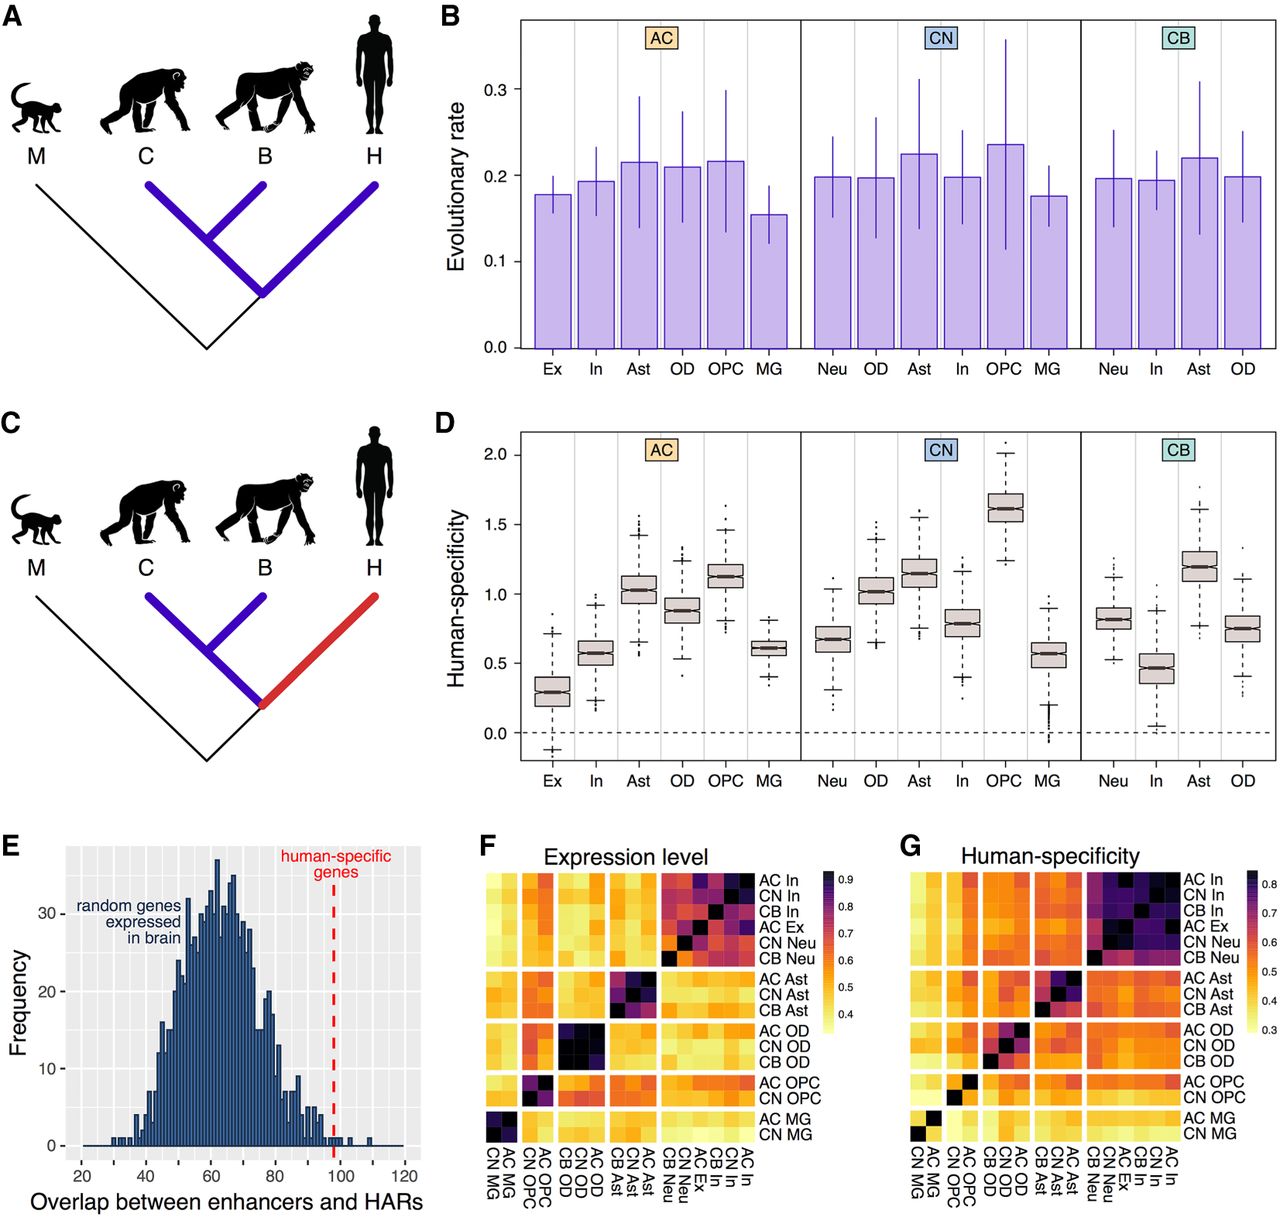
Cell-type-based analysis of the expression evolution in three brain regions. (A) Phylogenetic tree highlighting the branches used in the evolutionary rate analysis. (B) The evolutionary rate of cell types within each brain region. Error bars mark the standard deviation of the average estimates. (C) Phylogenetic tree highlighting the branches used in the human-specificity ratio analysis. (D) Human-specificity ratio calculated within each t-SNE cluster in each of the three brain regions. The ratio represents the number of genes with human-specific expression divided by the number of genes with chimpanzee-specific and bonobo-specific expression. Boxes mark the median and the first and the third quartiles of the distribution, and whiskers extend to the 1.5 interquartile ranges. The cell types are abbreviated as in Figure 3F. (E) Overlap between enhancers linked to 1271 genes showing human-specific expression in snRNA-seq data and brain-active cis-regulatory elements located in HARs (Vermunt et al. 2016). The histogram represents the distribution of the overlap values calculated by random subsampling of 1271 genes from the 9138 genes expressed in the brain 1000 times. The red dashed line marks an actual overlap (n = 98). (F) The expression level similarity among t-SNE clusters based on the average gene expression levels within clusters in humans. The colors in F and G indicate Pearson correlation coefficients. (G) The similarity of human-specificity ratio estimates among t-SNE clusters calculated based on the comparison to chimpanzee and bonobo in 1000 bootstraps of cells.


