
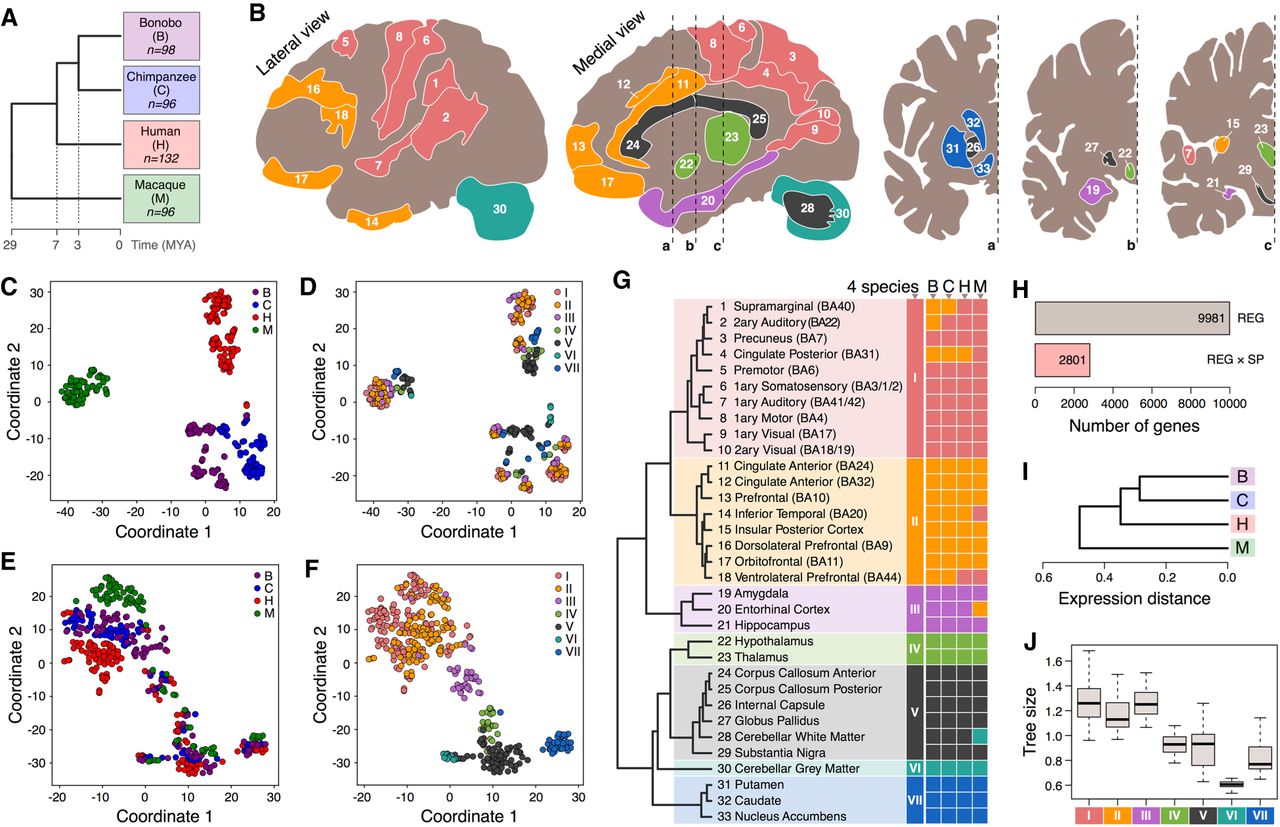
Gene expression variation analysis in 33 brain regions. (A) Phylogenetic relationship among analyzed species. Numbers indicate the number of analyzed brain samples. (B) Anatomical localization of 33 analyzed brain regions within the human brain. Colors represent expression-based regional clusters, defined in G. (C–F) t-SNE plots based on expression variation among all 422 analyzed samples: (C,D) the total variation; (E,F) the residual variation after removal of the average species’ and individual differences. Each circle represents a sample. Circle colors represent species (C,E) or expression-based regional clusters (D,F). (G) Unsupervised hierarchical clustering of brain regions based on the average gene expression values of all 11,176 detected genes in four species. Regions within each species are assigned to the nearest cluster. The clustering based on each individual sample is shown in Supplemental Figure S3. (H) Numbers of genes differentially expressed among brain regions (REG), or among species with a significant dependence on the region (REG × SP) in ANOVA. (I) Average phylogenetic tree reconstructed based on the expression differences identified using ANOVA with species and regions used as factors. The trees reconstructed for each brain region are shown in Supplemental Figure S5. (J) Total branch length calculated for the reconstructed phylogenetic trees for each of the 33 brain regions grouped by expression-based regional clusters I–VII, defined in G.


