
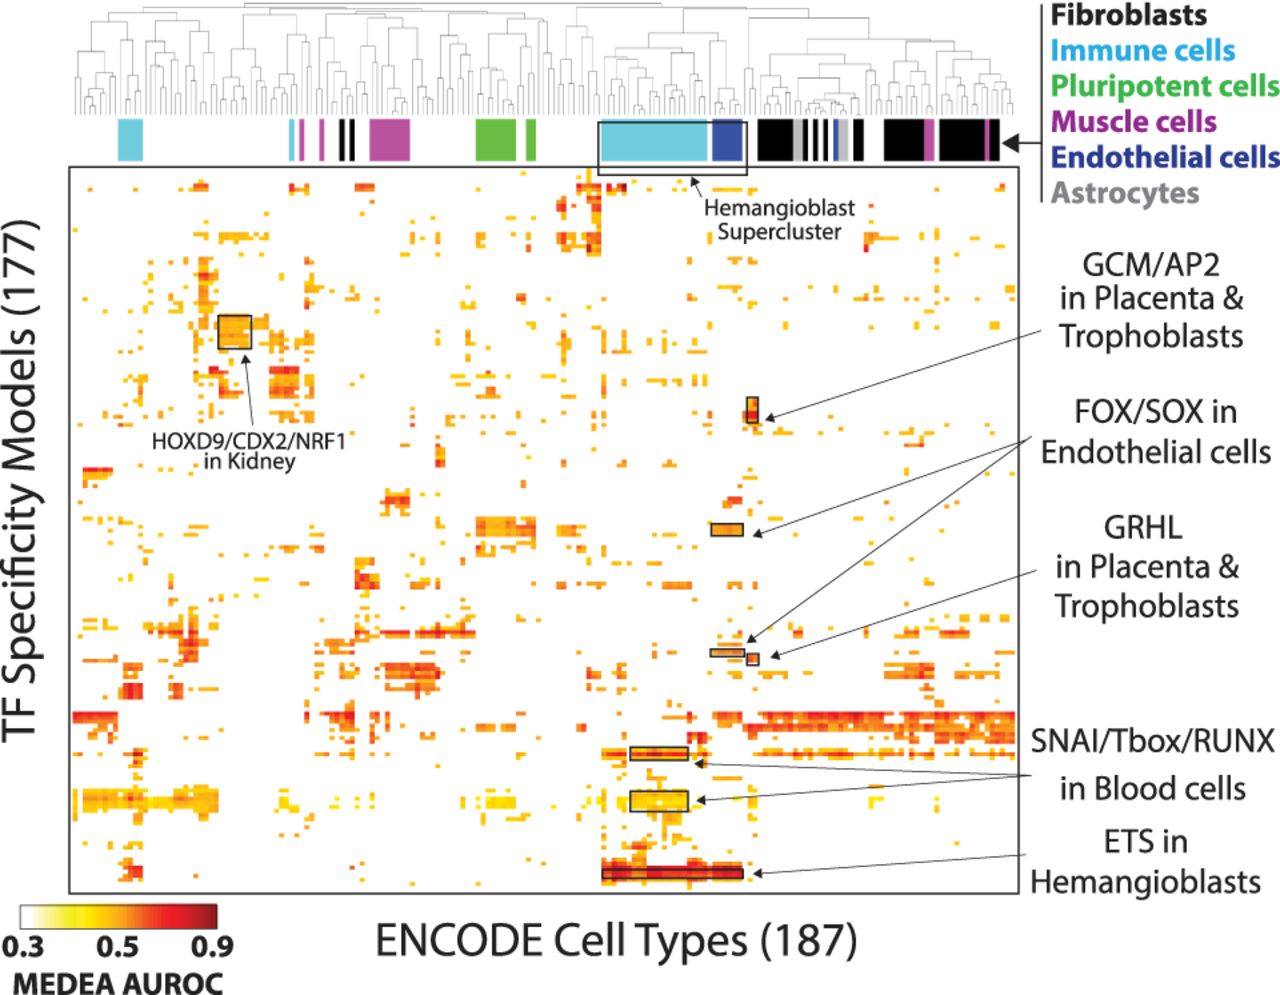
Figure 5.
Clustering analysis of MEDEA enriched motifs in ENCODE data sets reveals the TF regulatory patterns behind cellular differentiation. 2D-hierarchical clustering of the MEDEA AUROC values for the high pool (Fig. 4A, center). Black frames within the heatmap outline examples of enriched motifs within the indicated phenotypes. Colored bars to the top of the heatmap show how six representative cell type classes (top right) are distributed upon clustering.


