
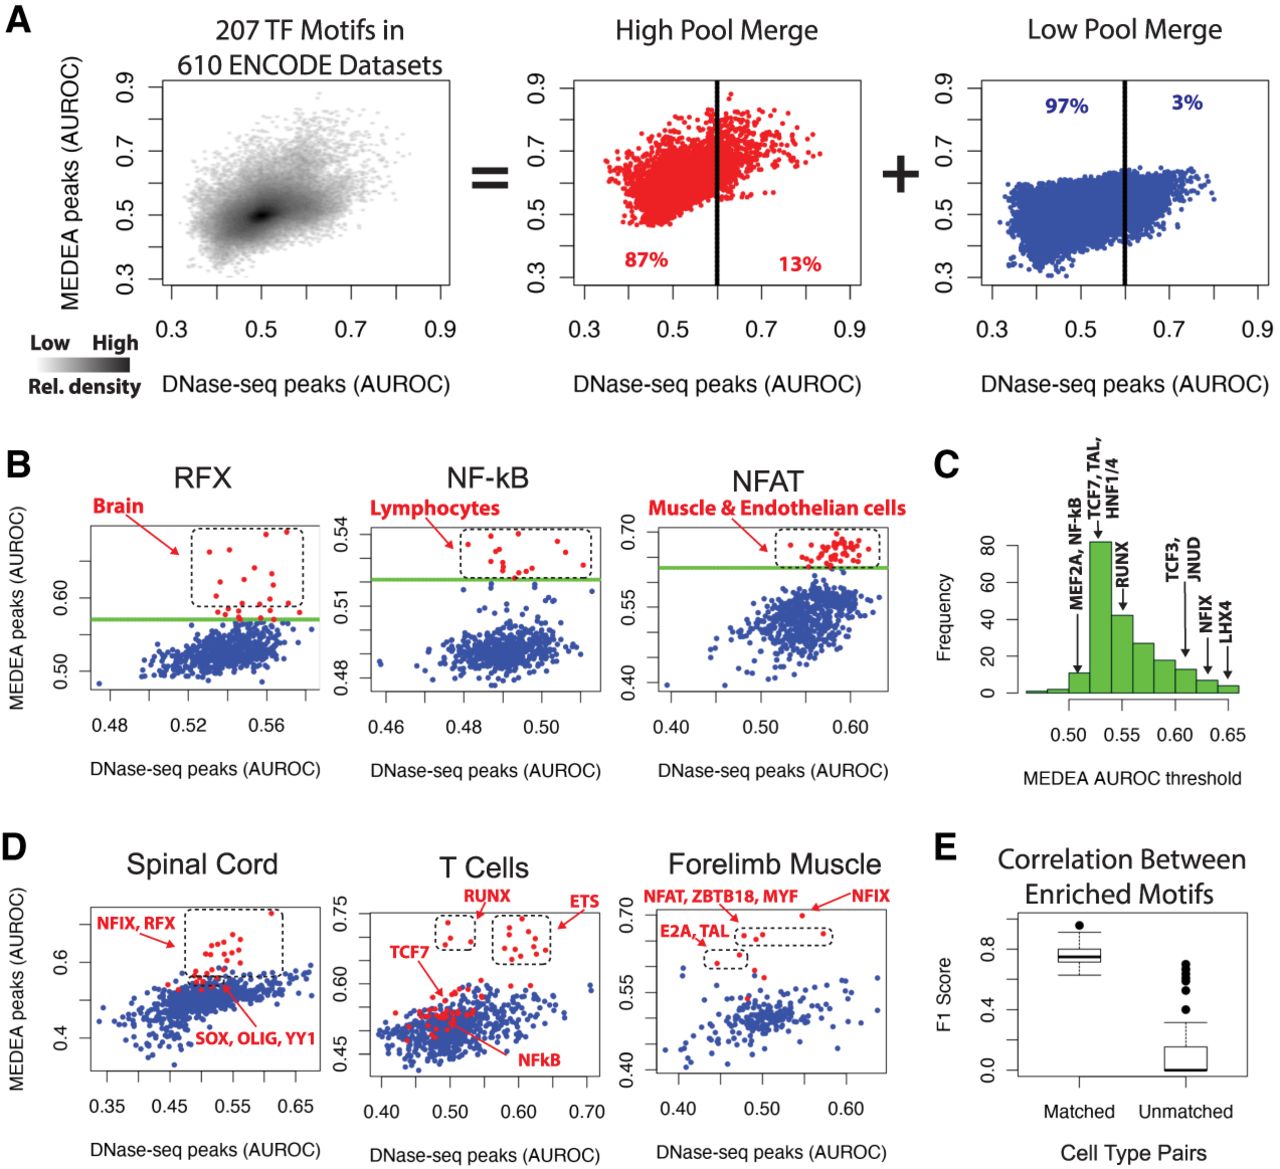
MEDEA analysis of 610 ENCODE DNA-seq data sets reveals known and novel enriched TF motifs. (A, left) Density distribution of the AUROC values obtained from the 207 TF specificity models (i.e., 99 PWMs and 108 k-mer models) in 610 ENCODE DNase-seq data sets (Supplemental Tables S1, S3). (Center, right) Merging the high (center) or low (right) pools for all the TF specificity models shows how the whole density distribution is formed by these two pools. The “high pool” refers to motif/cell type combinations whose MEDEA AUROC is above the motif's empirically derived threshold. Percentages refer to the motif/cell type combinations distinguished by the depicted AUROC threshold of 0.6 for the unfiltered DNase-seq peaks (black lines). (B) For the indicated specificity models, the subset of AUROC values from A. Each dot corresponds to the AUROC enrichments of the indicated motif in a particular cell type. For the most relevant MEDEA AUROC values, the underlying cell types are indicated. By setting a threshold at ∼3 SD away from the MEDEA AUROC median for each specificity model (green line) (Supplemental Table S3.2, Methods), the subsets were divided into high and low pools (red and blue points, respectively) (Supplemental Table S3.3). (C) A histogram of the 207 threshold values applied to all the motif-based subsets (Supplemental Table S3.2) to call high and low pools. The threshold values are highlighted in the scatterplots of B and of Supplemental Figures S11 and S12B. (D) For the indicated cell types, the subset of AUROC values from A. For the most relevant MEDEA AUROC values, the underlying TF specificity models are indicated. (E) For nine pairs of highly related cell types (Supplemental Methods), the TF specificity model classification in the “high pool” was used to calculate the F1 scores between either matched or unmatched cell types.


