
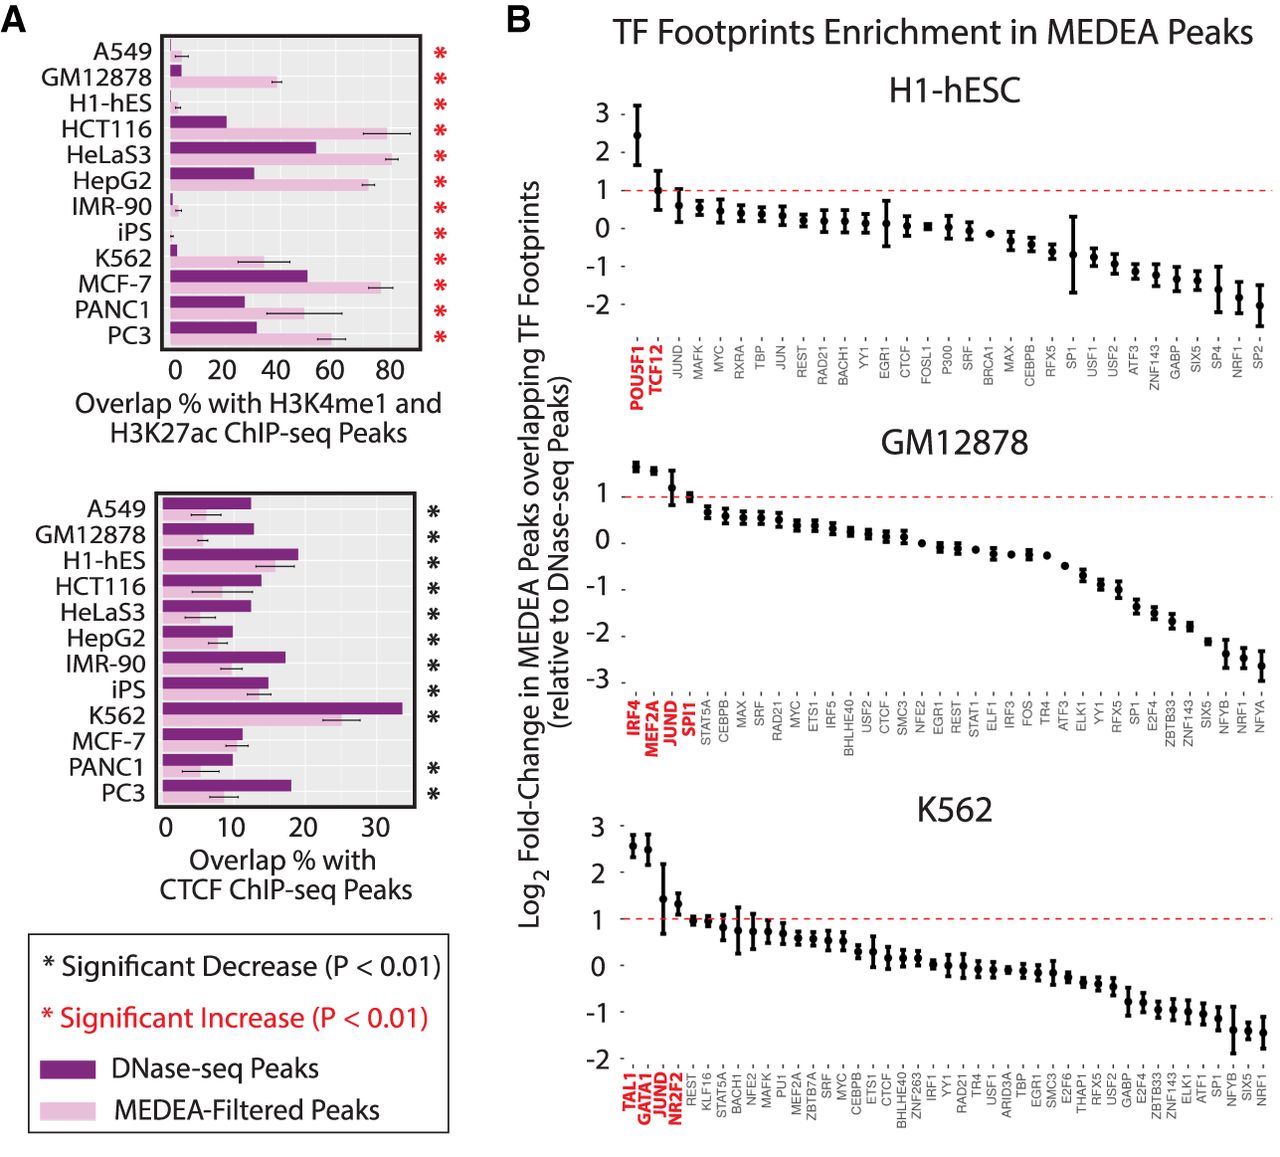
MEDEA filtering selects accessible peaks associated with active enhancers and TF binding. (A) Percentages of either the unfiltered DNase-seq peaks (purple bars; from Fig. 1A) or the MEDEA-filtered DNase-seq peaks (pink bars; mean and SD in each MEDEA-filtered series is presented; from Fig. 2B) that overlap ChIP-seq peaks for the indicated chromatin marks (top) or CTCF (bottom) in the indicated cell types. Asterisks indicate where the overlap percentages for the MEDEA-filtered peaks are significantly different (P < 0.01) from those of the unfiltered peaks (red stars indicate higher; black stars, lower). (B) The fold-change between the percentage of MEDEA-filtered peaks and unfiltered DNase-seq peaks that overlap DNase-seq footprints (DFPs) of the indicated TF. ChIP-seq-validated footprints were obtained from the HINT algorithm (Li et al. 2019). TFs were ordered according to fold-change of DFP overlap upon MEDEA filtering (red labels highlight TFs with mean fold-change > 2).


