
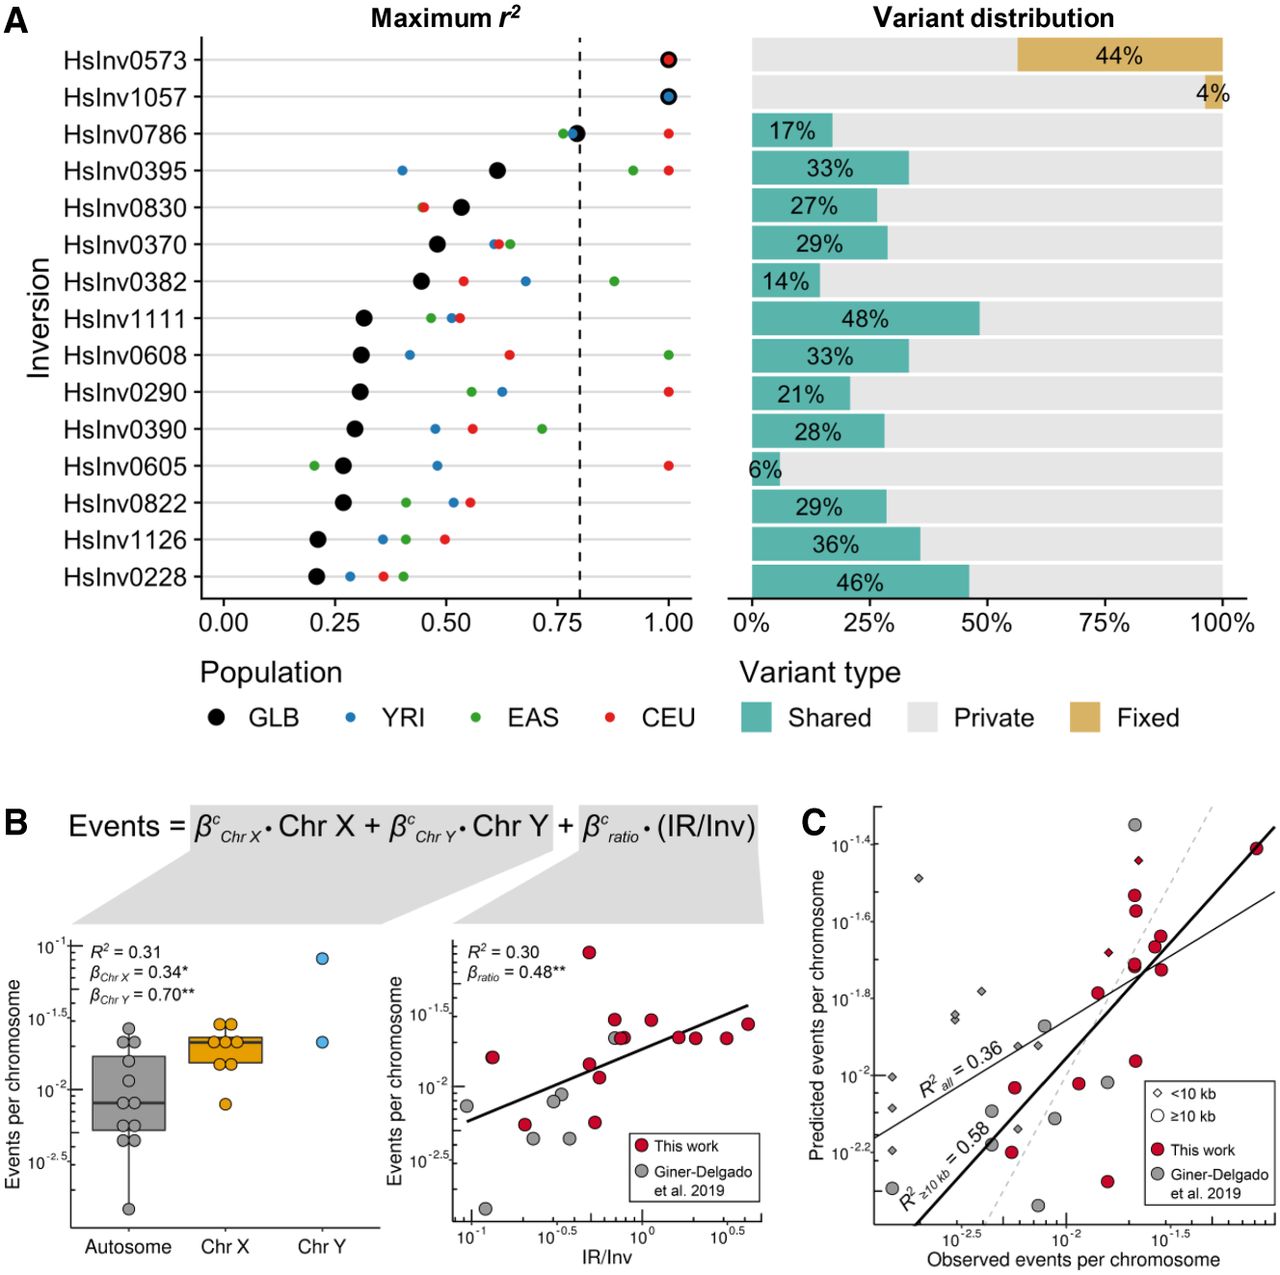
Nucleotide variation and recurrence analysis of genotyped inversions in human populations. (A) For the 15 newly genotyped autosomal and Chr X inversions, maximum LD (r2) with 1000GP variants located 1 Mb at each side of the inversion in all individuals together (black dots) and different populations (colored dots) is shown at the left, and the proportion of SNPs within each inversion classified as fixed (yellow), shared between orientations (green), or private of one orientation (gray) at the right. (B) Effect size (β) and variance explained (R2) by the chromosome type (left) and the IR/inverted region (Inv) size ratio (right) of the logarithm-transformed number of independent inversion events per chromosome was estimated for 22 inversions >10 kb from this work and Giner-Delgado et al. (2019). P values: (*) P < 0.05, (**) P < 0.01. (C) Adjustment of the observed inversion events and the expected number calculated by applying the developed model to all inversions in both studies. The number of observed events is underestimated in small inversions (<10 kb; diamonds), which results in a lower R2 value for all inversions (all, thin black line) than for those >10 kb (≥10 kb, thick black line). Dashed line represents the 1:1 equivalence.


