
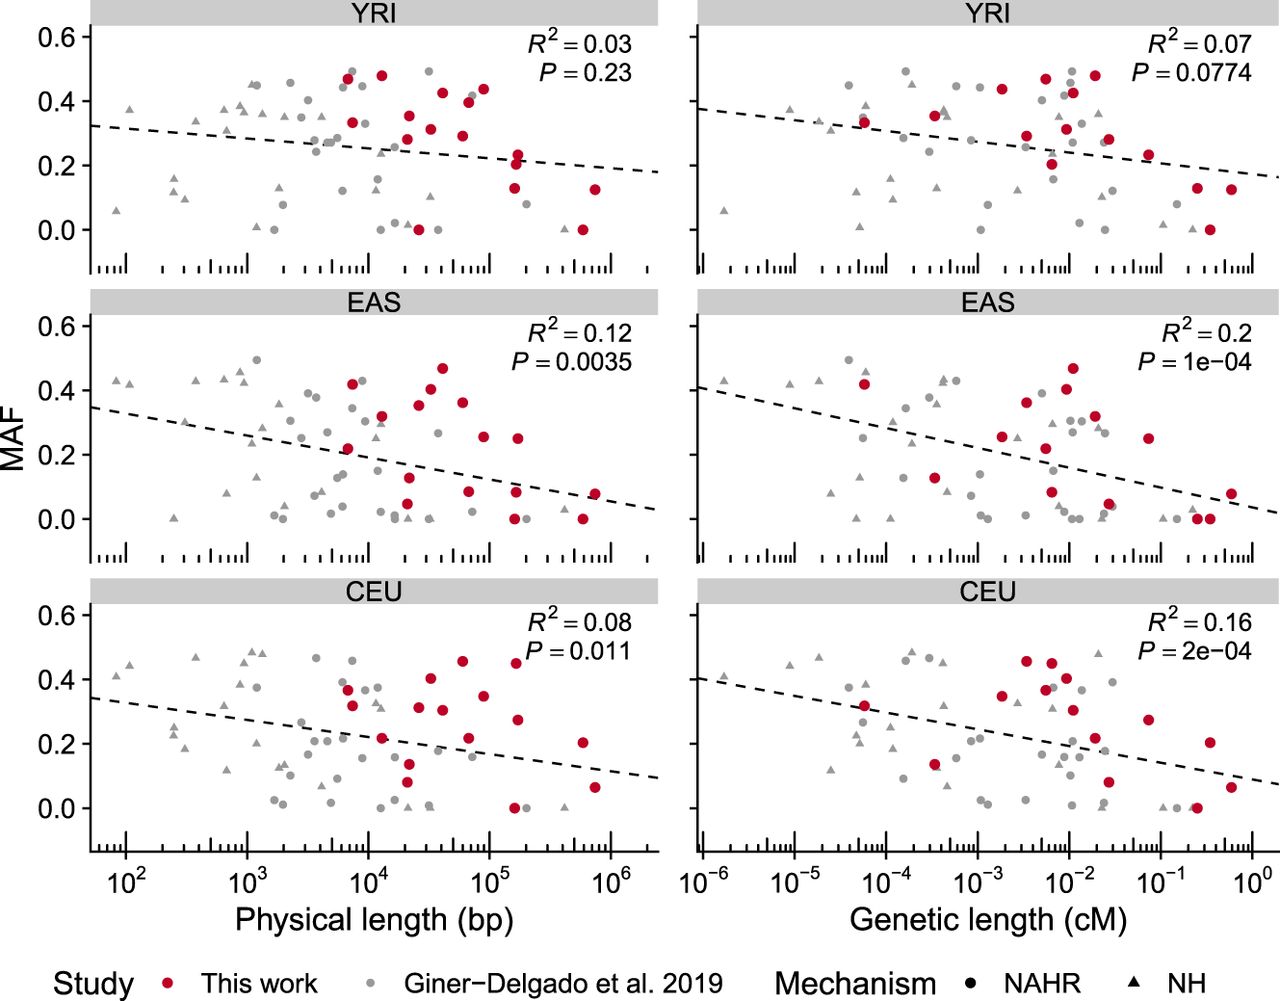
Figure 2.
Correlation between inversion size and frequency. Graphs show a negative correlation between the logarithm of the minimal physical or genetic length and minor allele frequency (MAF) of inversions in three populations with African (YRI), East Asian (EAS), and European (CEU) ancestry. Values are those from 61 inversions, including the 16 ddPCR-analyzed inversions (in red) and 45 previously described inversions (in gray), which comprise inversions generated by nonhomologous mechanisms (NH) or nonallelic homologous recombination (NAHR), although similar results were obtained with each separate data set (see Supplemental Methods for details).


