
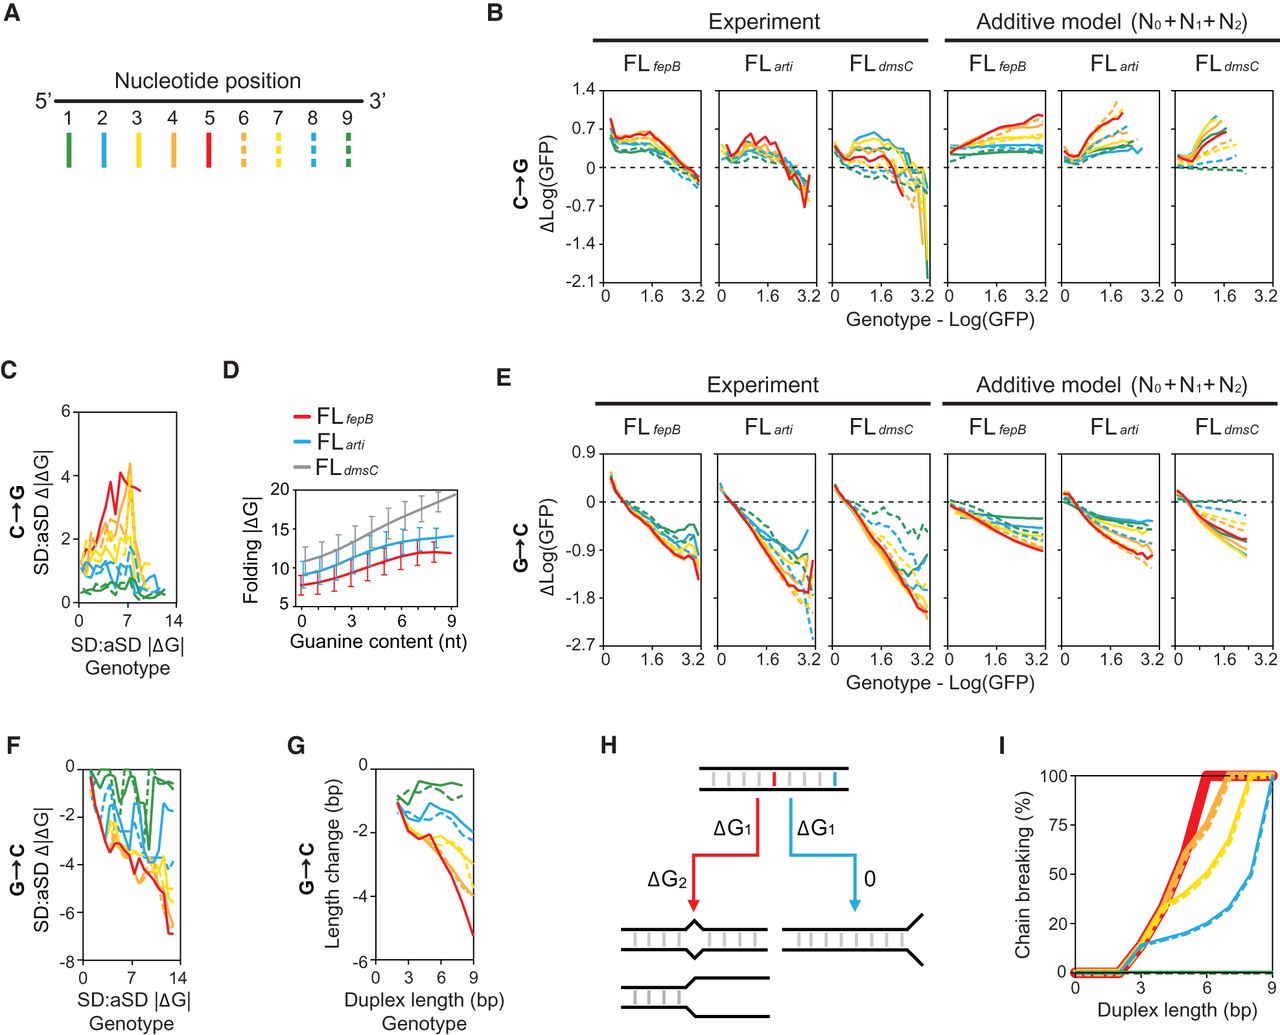
Global spectrum of mutational effects. (A) Markers of nucleotide positions. (B,C) Relationship between the fitness (Log[GFP]) (B) and SD:aSD base-pairing energy (ΔG) (C) of genotypes and the effects of C→G mutations. (D) Relationship between the guanine content of SD and the RNA folding energy (ΔG) of 30-nt RBS. Genotypes are ranked by the guanine content and grouped into 10 bins. Lines and bars indicate group means and standard deviations, respectively. (E–G) Relationship between the fitness (E), SD:aSD base-pairing energy (F), and SD:aSD duplex length (G) of genotypes and the effects of G→C mutations. (B,C,E–G) Genotypes are ranked by the considered phenotypes and grouped into 20, 20, 20, 20, and 10 equal-sized bins, respectively. For each phenotype-ranked group, the mean phenotypic effects of mutations at each nucleotide position in SD are computed and shown by lines styled according to A. (C,D,F) The predictions of ΔG are ≤0 and shown as absolute values for simplicity. (B,E) The additive model predicts mutational effects based on the fitness contribution of RBS contexts (N0), single nucleotides (N1), and pairwise epistasis (N2). (H) Chain-breaking model. Mismatch mutations occurring at the internal (red) and the edge (blue) of a RNA duplex are highlighted: (ΔG1) energy penalty caused by base-pairing mismatches; (ΔG2) energy penalty caused by breaking the base-pairing chain. (I) Probability of chain-breaking mutations as a function of the nucleotide position and the duplex length formed by two 9-nt position-aligned RNA strands made of any sequences. The chain-breaking probability at each nucleotide position is shown by lines styled according to A.


