
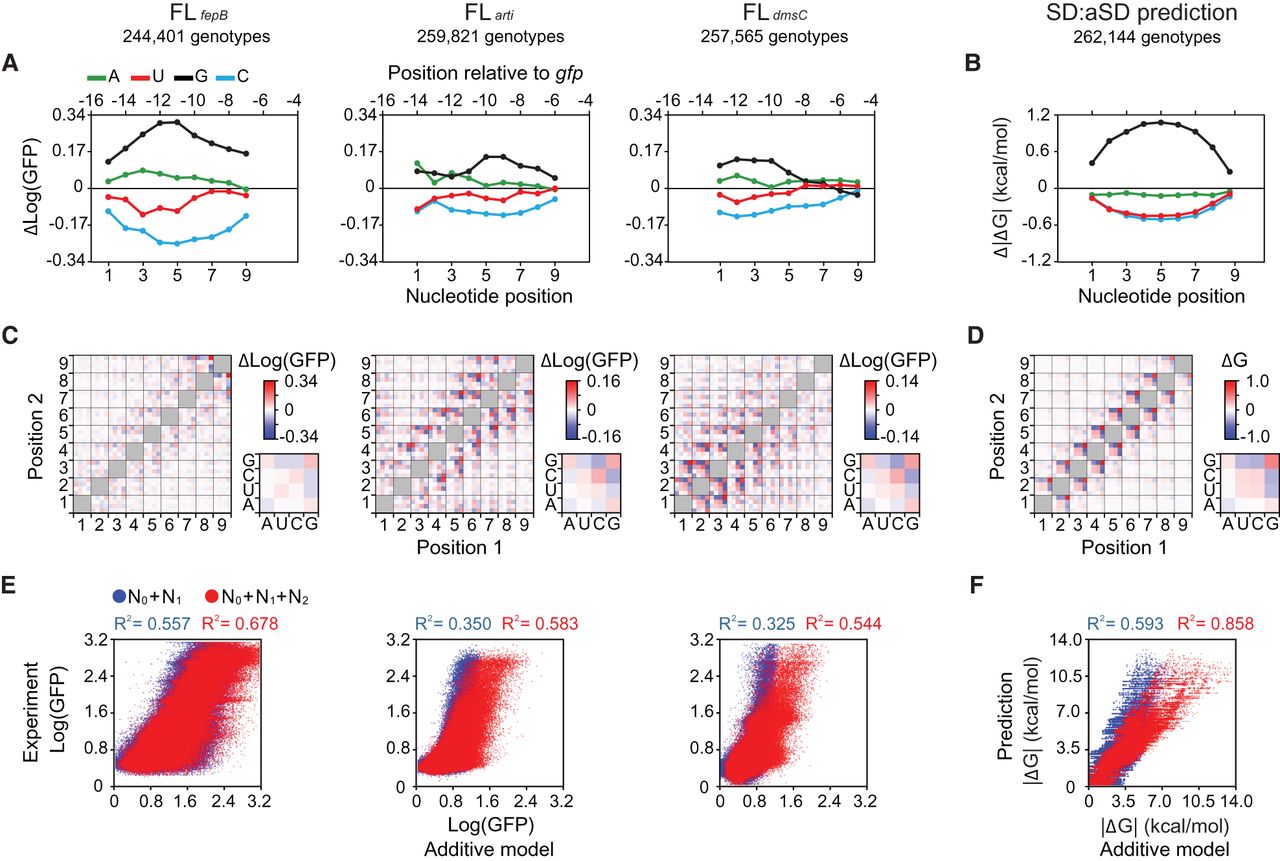
Fitness contribution of single nucleotides and pairwise epistasis. (A,B) Mean effects of single nucleotides on fitness (Log[GFP]) (A) and SD:aSD base-pairing energy (ΔG) (B). (C,D) Mean effects of pairwise epistasis on fitness (C) and SD:aSD base-pairing energy (D). Color bars, large heatmaps, and small heatmaps show measurement scales, nucleotide–nucleotide epistasis across the SD sequence, and the averaged patterns of epistasis between each nucleotide position and its two upstream and two downstream neighbors, respectively. (E,F) Explanatory power (R2) of the RBS context (N0), single nucleotides (N1), and pairwise epistasis (N2) on fitness (E) and SD:aSD base-pairing energy (F). (B,D,F) ΔG (predicted values ≤0) is shown as absolute values for simplicity.


