
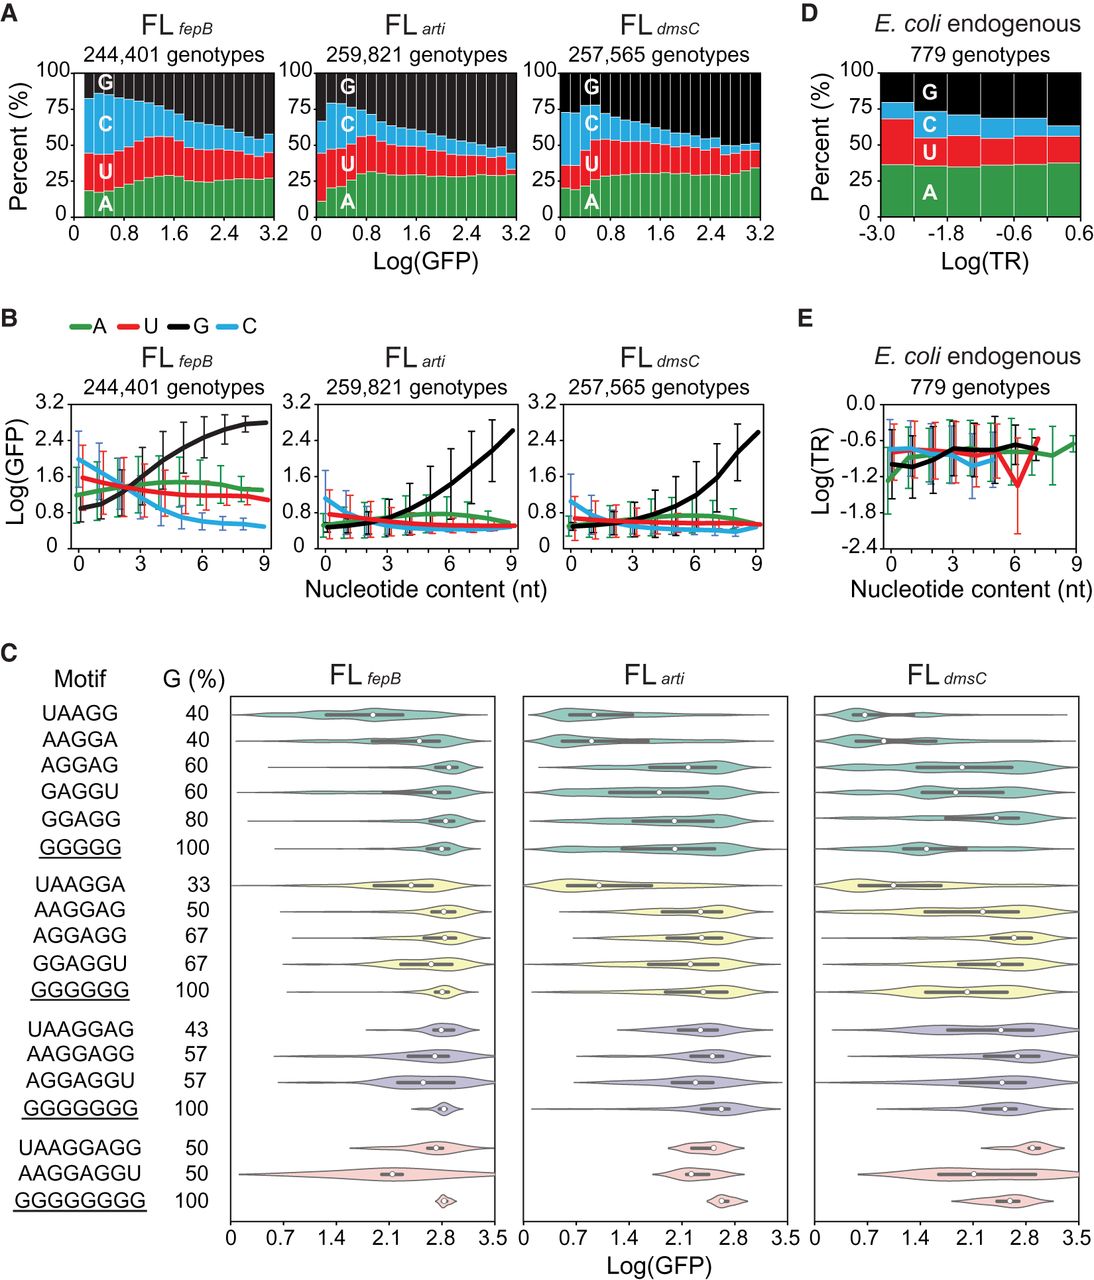
Biochemical properties of the SD sequence. (A) Relationship between fitness (Log[GFP]) and nucleotide composition. Genotypes are ranked by fitness and grouped into 20 equal-sized bins. (B) Relationship between the nucleotide content and fitness. Genotypes are ranked by the amount of each nucleotide type and grouped into 10 bins (i.e., 0–9 nt). Lines and bars indicate group means and standard deviations of fitness, respectively. (C) Influence of sequence motifs on fitness. The fitness distribution of genotypes bearing 5- to 8-nt poly(G) tracts (underlined) or canonical SD motifs is shown as violin plots, where medians and interquartile ranges are indicated by white circles and black lines, respectively. (D) Relationship between the translation rate (TR; ribosomes/s) and nucleotide composition of endogenous SD sequences in E. coli (Gorochowski et al. 2019). Genotypes are ranked by TR and grouped into six equal-sized bins. (E) Relationship between the nucleotide content and TR of endogenous SD. Genotypes are ranked by the amount of each nucleotide type and grouped into 12 bins (i.e., 0–11 nt). Lines and bars indicate group means and standard deviations of TR, respectively. (D,E) Endogenous SD is defined as the 11-nt region 5–15 nt upstream of the start codon of a protein-coding sequence. TR is shown in the logarithmic scale to allow a direct comparison with fitness quantified in this study.


