
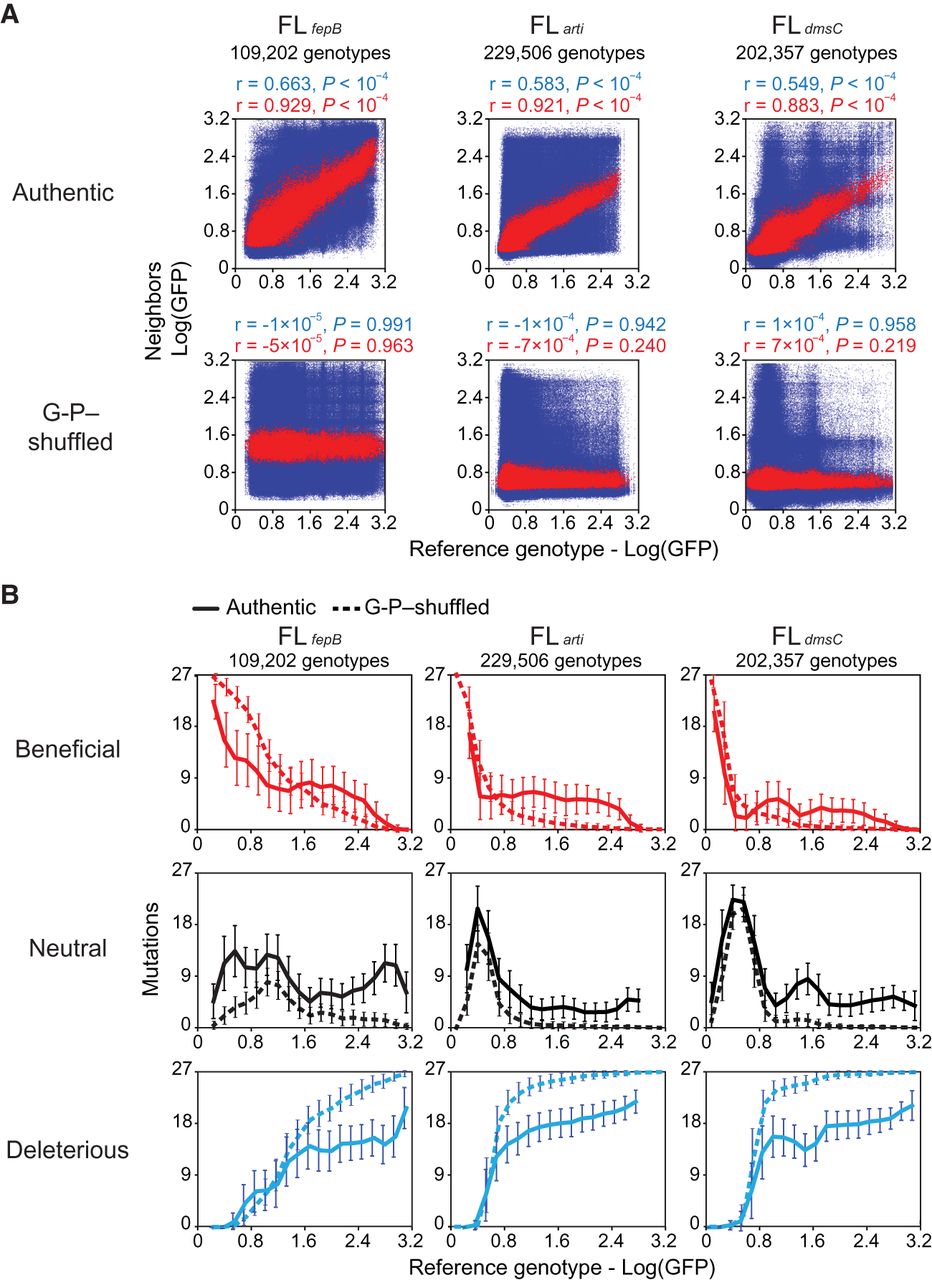
G-P correlation and the distribution of mutational effects. (A) Correlations (Pearson's r, permutation test) between the fitness of a genotype and the individual fitness (blue) or the mean fitness (red) of its 27 single-mutation neighbors in the authentic fitness landscapes or in a representative of 10,000 G-P–shuffled fitness landscapes. (B) Relationship between the fitness of a genotype and the amount of beneficial, neutral, and deleterious mutations in this genetic background in the authentic or the representative G-P–shuffled fitness landscapes. The 27 point mutations a genotype would acquire are assigned into beneficial, neutral, and deleterious categories based on an operational cutoff defined by sort-seq measurement errors (FLfepB = 0.168, FLarti = 0.108, and FLdmsC = 0.198). Genotypes are ranked by fitness and grouped into 20 equal-sized bins. Lines and bars indicate group means and standard deviations, respectively. (A,B) Only genotypes with their 27 single-mutation neighbors fully characterized are considered.


