
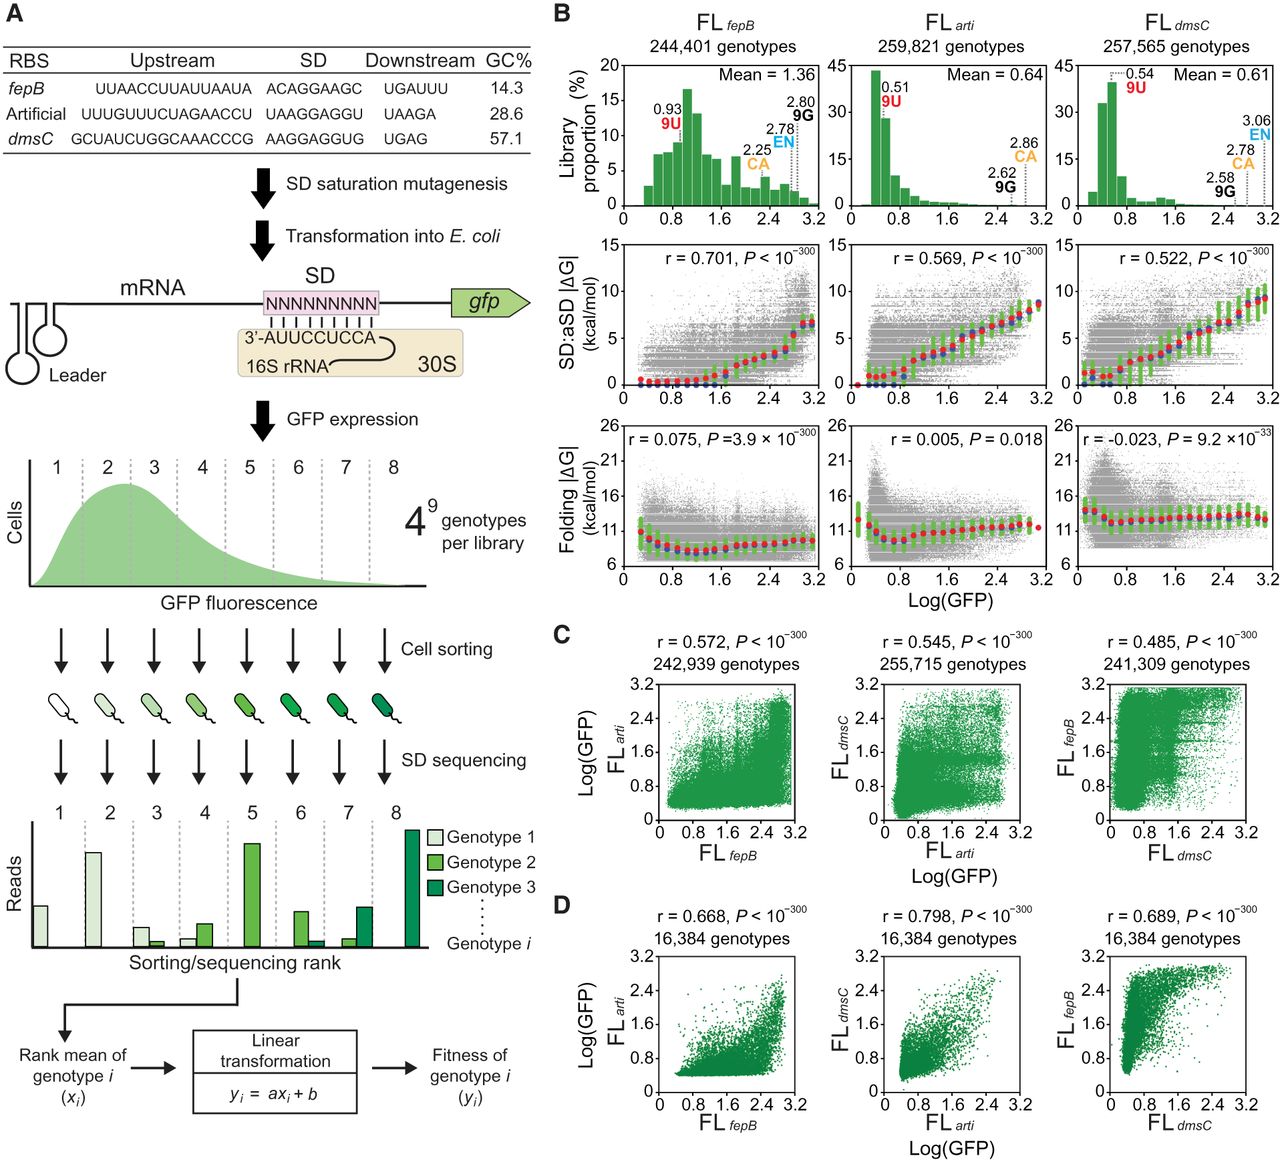
G-P associations of the SD fitness landscapes. (A) Determining SD G-P associations. SD libraries under three RBS contexts are generated and assayed in E. coli. Cell sorting divides a library into multiple ranks based on GFP expression. The genotypic composition of each rank is revealed by Illumina sequencing. The fitness (Log[GFP]) of a genotype is determined by its read count distribution transformed through a linear equation describing the correlation between the rank means and GFP fluorescence. (B) Distribution of the fitness of genotypes (upper) and its correlations (Pearson's r, t-test) with SD:aSD base-pairing energy (ΔG, middle) and mRNA folding energy (ΔG, lower). ΔG (predicted values ≤0) is shown as absolute values for simplicity. Genotypes are ranked by fitness and grouped into 20 equal-sized bins. Group means, medians, and interquartile ranges of ΔG are shown as red circles, blue circles, and green bars, respectively. The fitness of canonical SD (CA), endogenous SD (EN), and genotypes made of nine guanines (9G) and nine uracils (9U) is shown. (C) Phenotypic correlation (Pearson's r, t-test) of 9-nt SD genotypes between fitness landscapes. (D) Phenotypic correlation (Pearson's r, t-test) of 7-nt SD genotypes. The 9-nt SD genotypes of each fitness landscape are divided into 47 7-nt genotypic subsets according to the sequence located 7–13 nt upstream of the start codon. The mean fitness of 9-nt genotypes in each 7-nt subset is computed and compared between fitness landscapes.


