
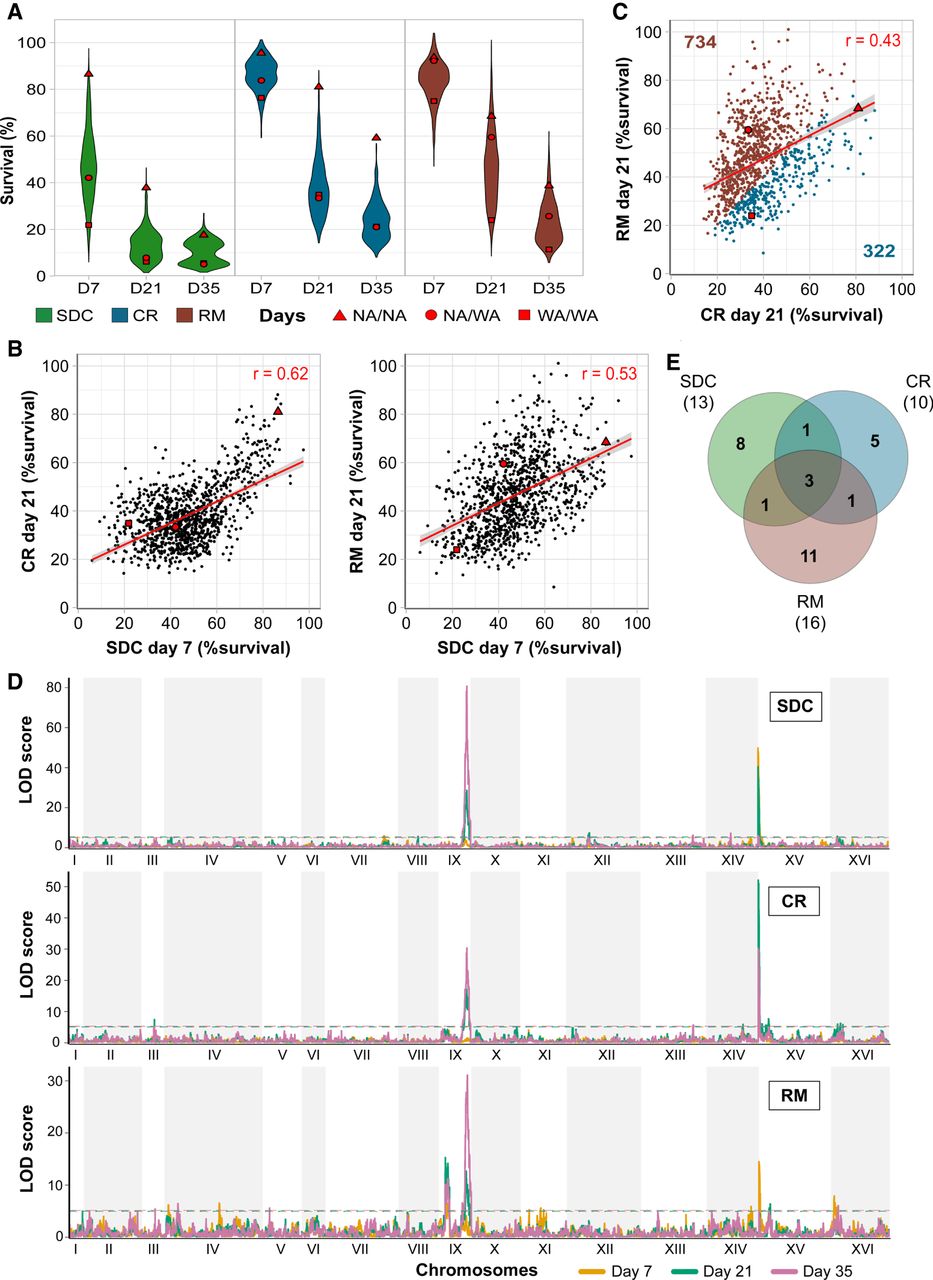
Calorie restriction and rapamycin extend life span through different genetic variants. Chronological life span of 1056 diploid segregant lineages from an F12 NA/WA advanced intercross. CLS was measured by counting viable cells (%) 7, 21, and 35 d after entry into quiescence, following growth in calorie-sufficient (SDC), -restricted (CR), and rapamycin (RM) media. Red: Founder homozygote parents (NA/NA, WA/WA) and their F1 hybrid (NA/WA). (A) CLS distributions across time points and conditions. (B) Comparing CLS across environments and time points. Red line: linear regression, with 95% confidence interval. (C) CLS comparison in RM and CR. Numbers: lineages living longer in CR (blue) or RM (brown). (D) Linkage analysis of CLS. Panels: calorie-rich (top), -restricted (middle), and rapamycin (bottom) media. Line color: 7 (yellow), 21 (green), and 35 (purple) days after entry into quiescence. y-axis: LOD score, x-axis: genome position. Dashed lines: Significance QTL (α = 0.05). (E) QTLs private to and shared between environments. Numbers in parentheses: total QTLs per environment.


