
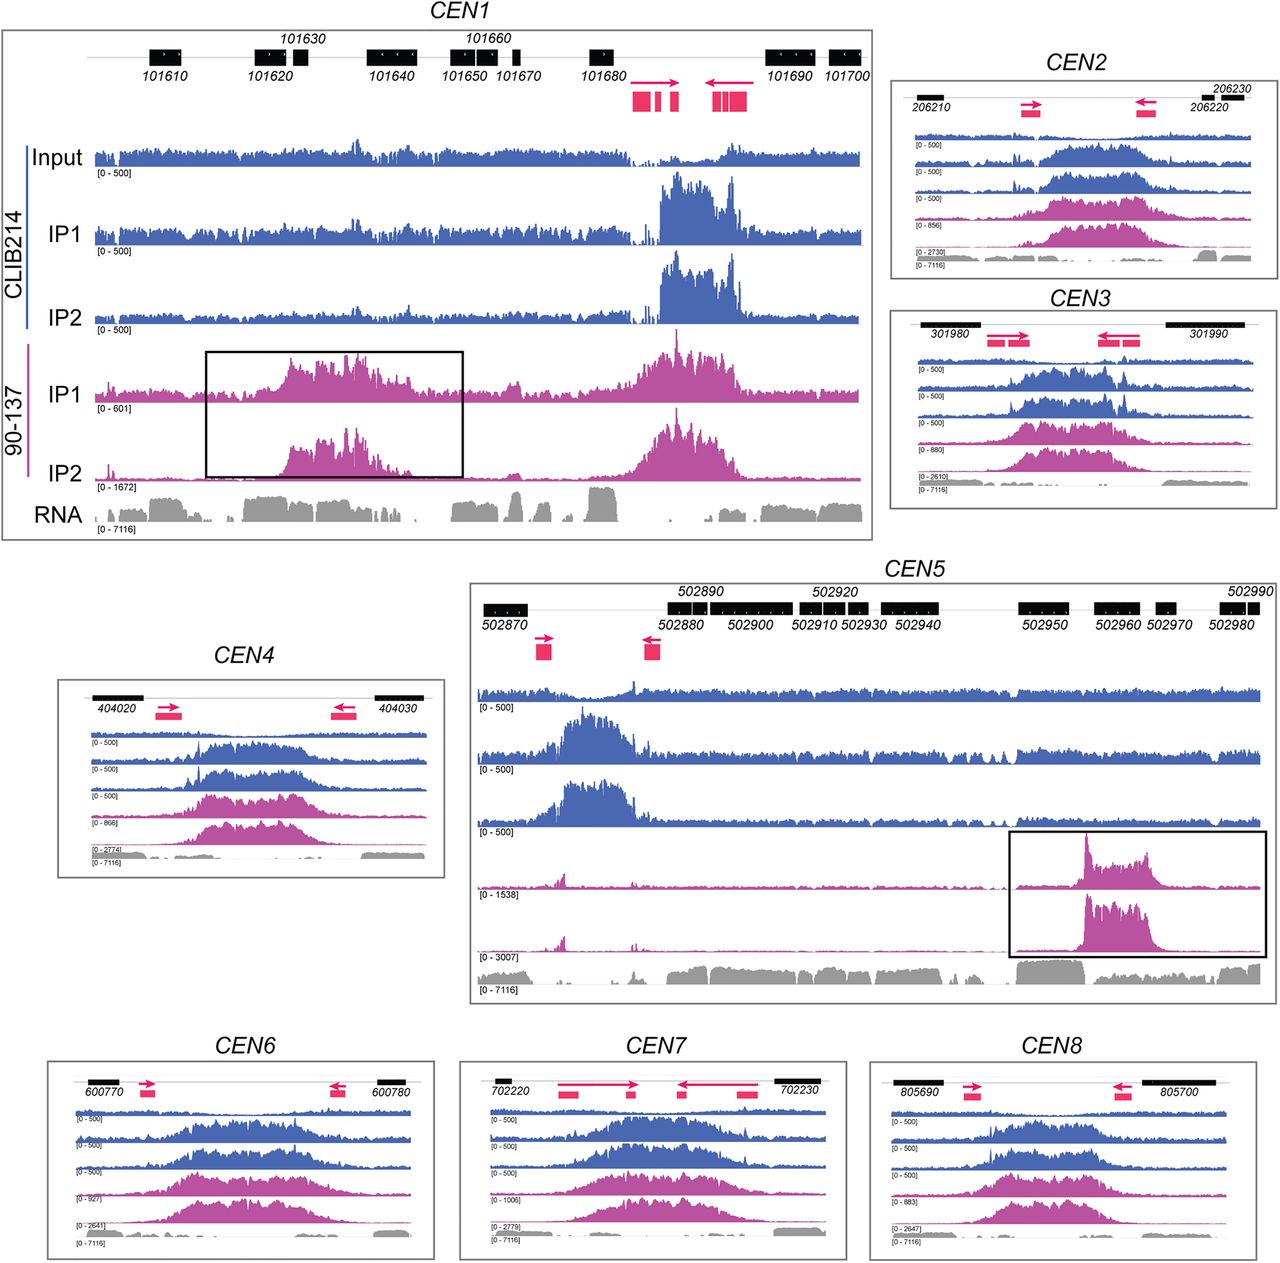
Natural polymorphisms for centromere location in C. parapsilosis. The ChIP-seq data from Figure 1D is shown in more detail, and the neocentromeres are highlighted with black boxes. The order of the tracks is the same in each panel but is labeled for CEN1 only. The top track shows the location of C. parapsilosis protein coding genes. The second track shows the IR sequences only (red), with an arrow indicating the direction of the repeat. The extent of the regions conserved between chromosomes is not shown. ChIP-seq read coverage is plotted in blue for C. parapsilosis CLIB214 and in purple for C. parapsilosis 90-137. Two independent immunoprecipitation experiments were performed per strain (IP1 and IP2). Only one control is shown; the total chromatin from C. parapsilosis CLIB214 (input). The equivalent data for C. parapsilosis 90-137, and for an experiment with no tagged Cse4, are available at GEO, accession number GSE136854. The bottom track (gray) shows gene expression measured by RNA-seq during growth in YPD (taken from SRR6458364 from Turner et al. 2018). The read depth scale is indicated in brackets; the total number of reads varied in each experiment. The maximum scale for C. parapsilosis CLIB214 is restricted to 500 to reduce the signal from the rDNA. The RNA expression data are plotted on a log scale. The apparent dips in coverage at the centromeres in the input data are likely to be an artifact of the mapping procedure because reads that map to more than one site in the genome were discarded. Some reads are also incorrectly mapped to nonidentical repeat sequences, resulting in a small Cse4 signal at CEN5 in 90-137. All data are visualized using IGV.


