
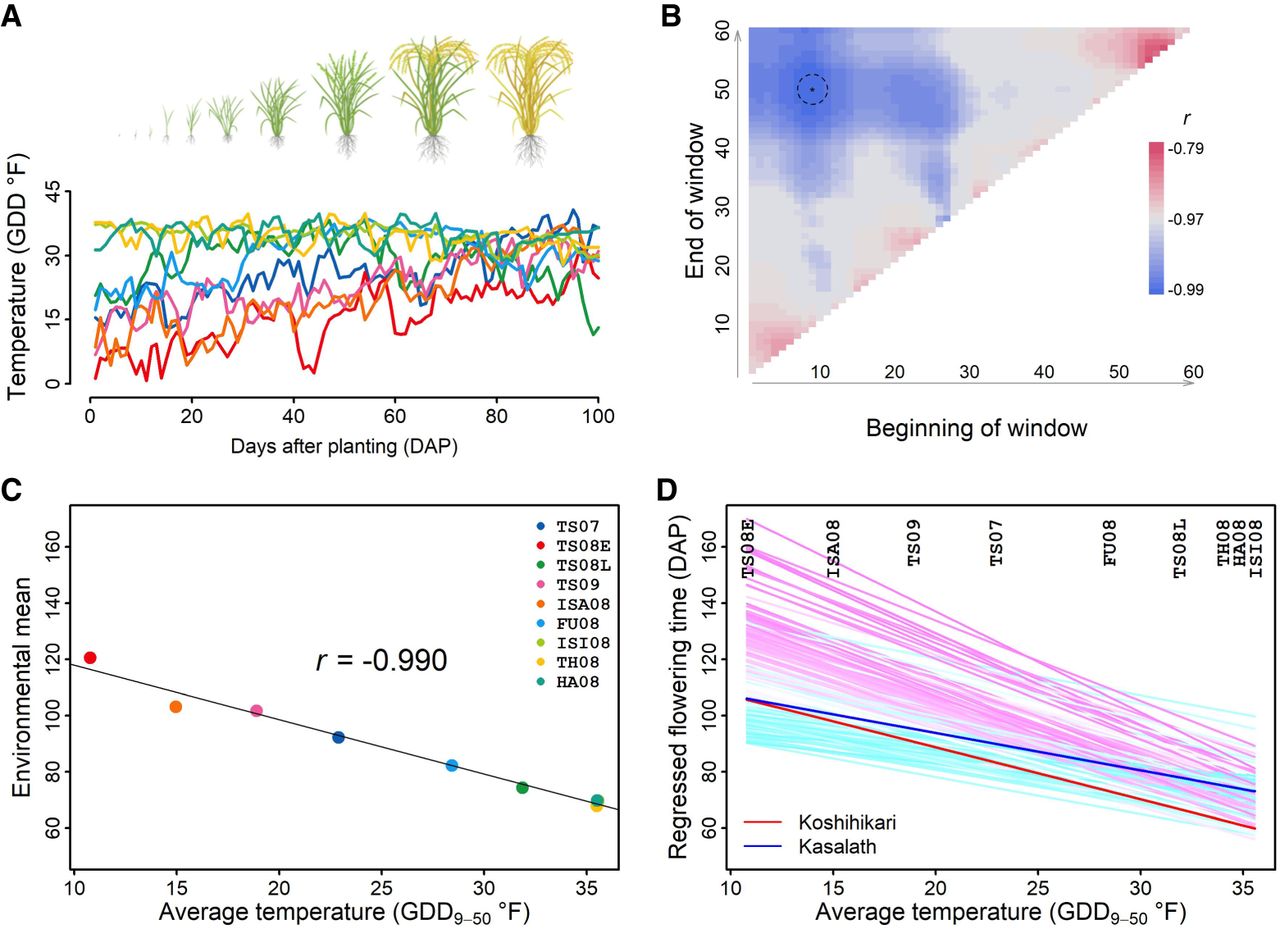
Figure 2.
Identifying an environmental index from the performance data. (A) Rice development and temperature (in GDD) profiles across different environments. (B) Search for the most indicative growth window within which average temperature is highly correlated to environmental mean of flowering time. Temperature within the window of 9–50 DAP was chosen as the environmental index and denoted as GDD9–50. (C) Significant correlation between GDD9–50 and environmental mean. (D) Regression-fitted reaction norm using the environmental index (GDD9–50) as the explanatory variable.


