
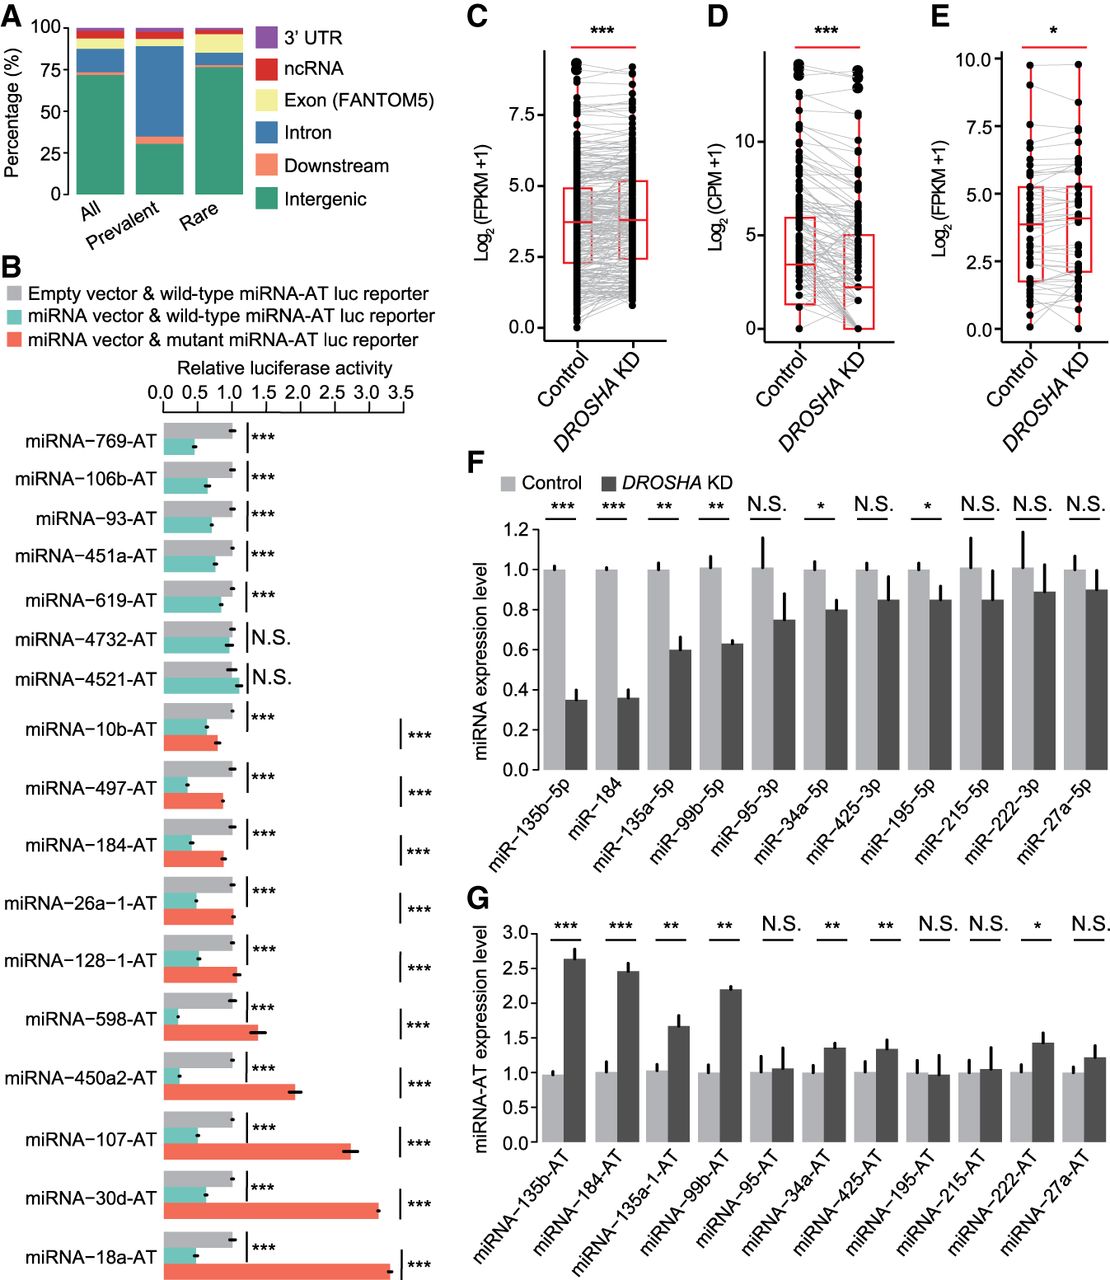
miRNAs regulate the expression of miRNA-ATs. (A) Annotation of the regions of miRNA-ATs that are opposite to pre-miRNAs: (intron) intronic region of both protein-coding and noncoding genes; (ncRNA) noncoding RNAs; (downstream) 1 kb downstream from a gene. All edited miRNA-ATs, as well as the prevalently and rarely edited miRNA-ATs, were separately annotated: (prevalently edited) edited in >70% of the normal tissues; (rarely edited) edited in <10% of the normal tissues. (B) Dual-luciferase reporter assays to detect the effect of sense miRNAs on miRNA-ATs. Wild-type or mutant (a deletion of a 7 nt sequences complementary to miRNA seed region) miRNA-AT sequences were inserted into the Renilla luciferase 3′ UTR. Firefly luciferase was used as a reference reporter. Luciferase reporters with either wild-type or mutant miRNA-ATs were cotransfected with either miRNA or empty vector, and 48 h later the luciferase activities were measured: (relative activity) average Renilla luciferase activity normalized to firefly luciferase in four biological replicates; (error bars) SD based on four biological replicates. P-values were calculated using student's t-test: (***) P < 0.001; (NS) not significant. (C–E) Comparison of expression levels of pri-miRNAs (C), mature miRNAs (D), and miRNA-ATs (E) between DROSHA knockdown and control HeLa cells. HeLa cells were selected because DROSHA was highly expressed (https://www.proteinatlas.org/ENSG00000113360-DROSHA/cell). pri-miRNA and miRNA-AT expressions were calculated using stranded mRNA-seq data. Mature miRNA expression was calculated using small RNA-seq data. Only pri-miRNAs and miRNA-ATs with FPKM ≥1 in at least one sample were used. Only mature miRNAs with CPM ≥1 in at least one sample were used. P-values were calculated using paired Wilcoxon signed-rank test: (***) P < 0.001; (*) P < 0.05; (CPM) counts per million. (F,G) Comparison of the expression levels of sense-mature miRNAs (F) or miRNA-ATs (G) between control and DROSHA knockdown HeLa cells. Five miRNAs were not significantly down-regulated on DROSHA knockdown, which may be because these miRNAs can still be effectively processed with reduced DROSHA protein level. (Error bars) SD based on three biological replicates. P-values were calculated using student's t-test: (*) P < 0.05; (**) P < 0.01.


