
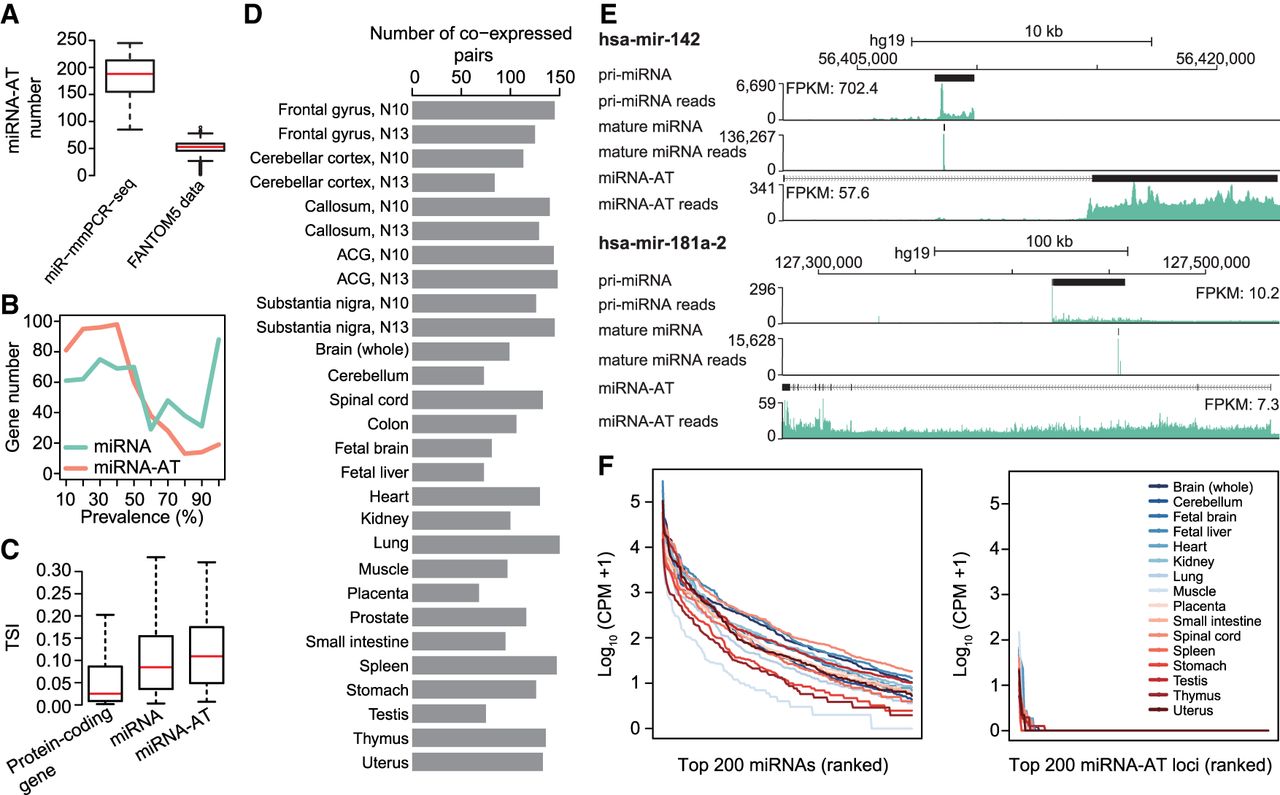
The characterization of miRNA-ATs. (A) Comparison of the number of miRNA-ATs detected using miR-mmPCR-seq data sets or FANTOM5 data sets. In miR-mmPCR-seq data sets, a miRNA-AT was defined as transcribed if it has at least 50 reads covered and one A-to-I editing site with editing levels ≥2%. Liver and bone marrow were excluded because fewer than 260 loci were amplified in these two tissues. In the FANTOM5 data sets, a miRNA-AT was defined as expressed if it has at least 10 reads covered in the CAGE data. The numbers of miRNA-ATs that were present in the FANTOM5 transcript atlas and expressed in each of the 1897 FANTOM5 samples were shown. (B) Prevalence of the expression of miRNA-ATs or miRNAs across different human tissue types. Prevalence of a miRNA-AT or miRNA is defined as the percentage of tissues with the miRNA-AT or miRNA expressed. A miRNA-AT or miRNA was defined as transcribed if it has at least 50 reads covered and one A-to-I editing site with editing levels ≥2%. The numbers of miRNA-ATs or miRNAs were shown in the y-axis. (C) Tissue specificity comparison between protein-coding genes, miRNAs, and miRNA-ATs using FANTOM5 data. The tissue specificity index (TSI) was used. TSI varies from 0 to 1, where 0 means broadly expressed, and 1 is specific. To avoid the confounding effect of protein-coding genes, miRNAs and miRNA-ATs that are overlapped with protein-coding genes were excluded from this analysis. Moreover, we required that genes were with counts per million (CPM) ≥1 in at least one FANTOM5 sample. (D) The number of coexpressed sense–antisense miRNA pairs inferred from coediting data in each sample. A sense–antisense miRNA pair was defined as coexpressed if both have edited sites (≥2%) detected in a given sample. The same samples as in A were used for analysis. (E) UCSC Genome Browser view of two miRNA loci. The genomic features and stranded mRNA-seq and small RNA-seq read coverages of the sense–antisense miRNA pairs were shown from top to bottom: (1) the annotation of the full-length pri-miRNA from FANTOM5, (2) the read coverage of the pri-miRNA calculated using stranded mRNA-seq, (3) the annotation of the mature miRNA, (4) the read coverage of the mature miRNA, (5) the annotation of the full-length miRNA-AT from FANTOM5, (6) the read coverage of the miRNA-AT calculated using stranded mRNA-seq. Stranded mRNA-seq of nuclear RNA and small RNA-seq of total cell RNA of GM12878 cells from the ENCODE Project were used for analysis. (F) Expression levels of mature miRNAs or putative mature miRNAs processed from miRNA-ATs. The top 200 genes were shown.


