
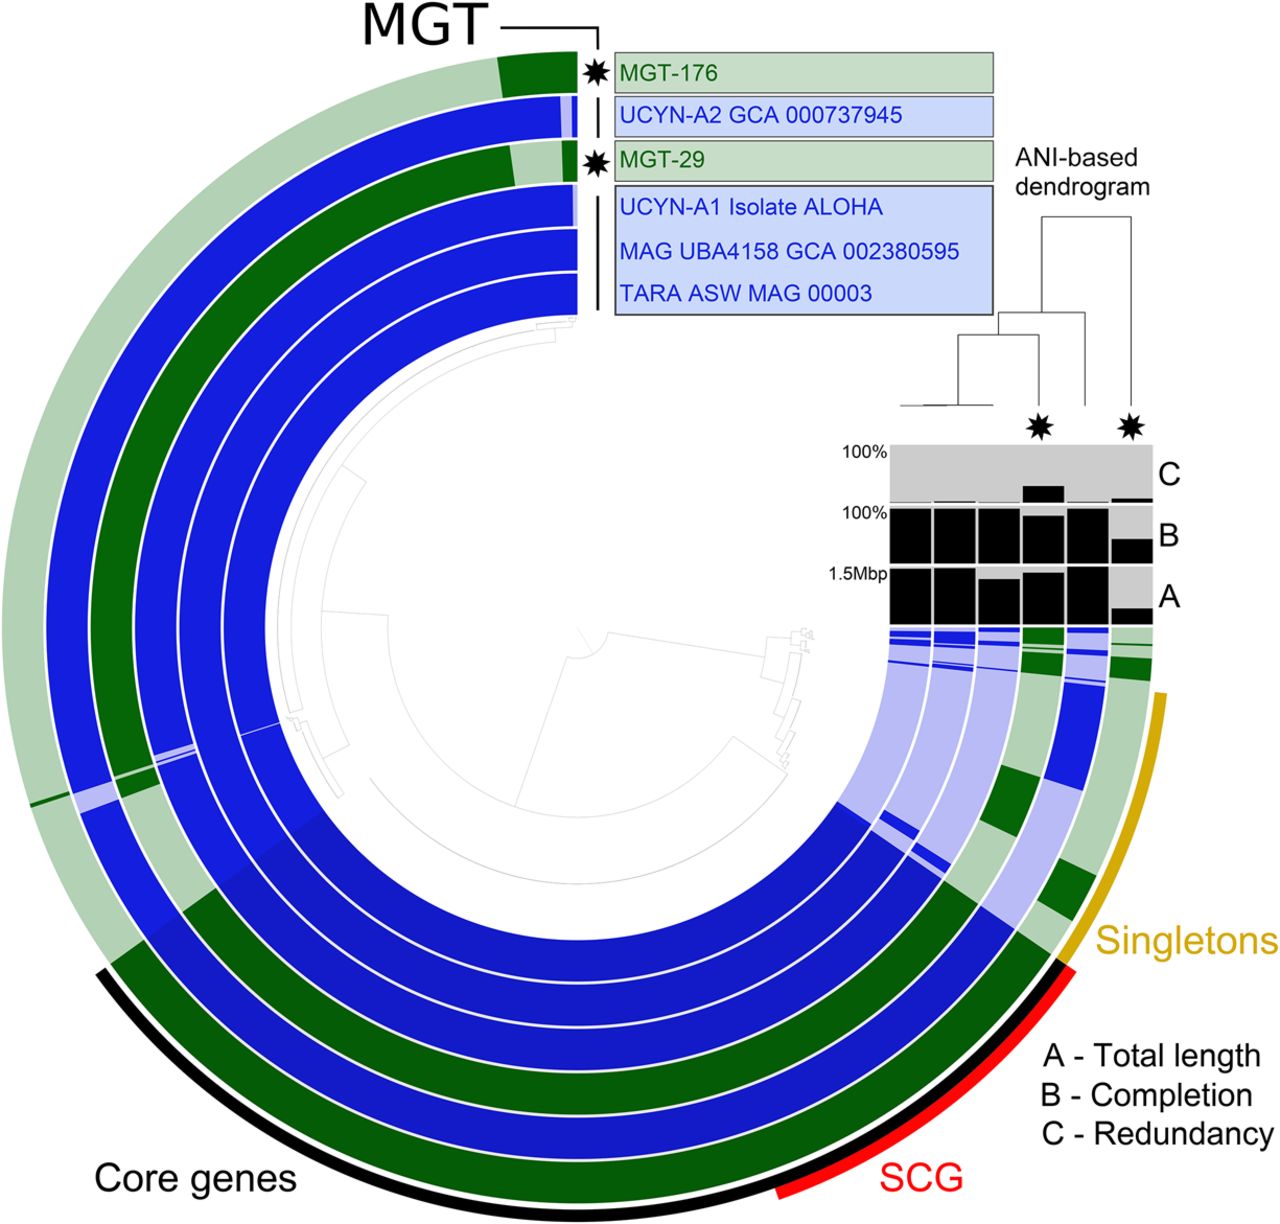
Figure 5.
The pangenomes of MGT-29 and MGT-176 compared to available reference sequences of UCYN-A. Each layer represents an MGT, a reference genome, or a MAG. Gene clusters are organized based on their distribution across samples. The dendrogram in the center organizes gene clusters based on their presence or absence in the samples. The top right dendrogram represents the hierarchical clustering of the samples based on the ANI values. (ANI) Average nucleotide identity, (SCG) single-copy core genes.


