
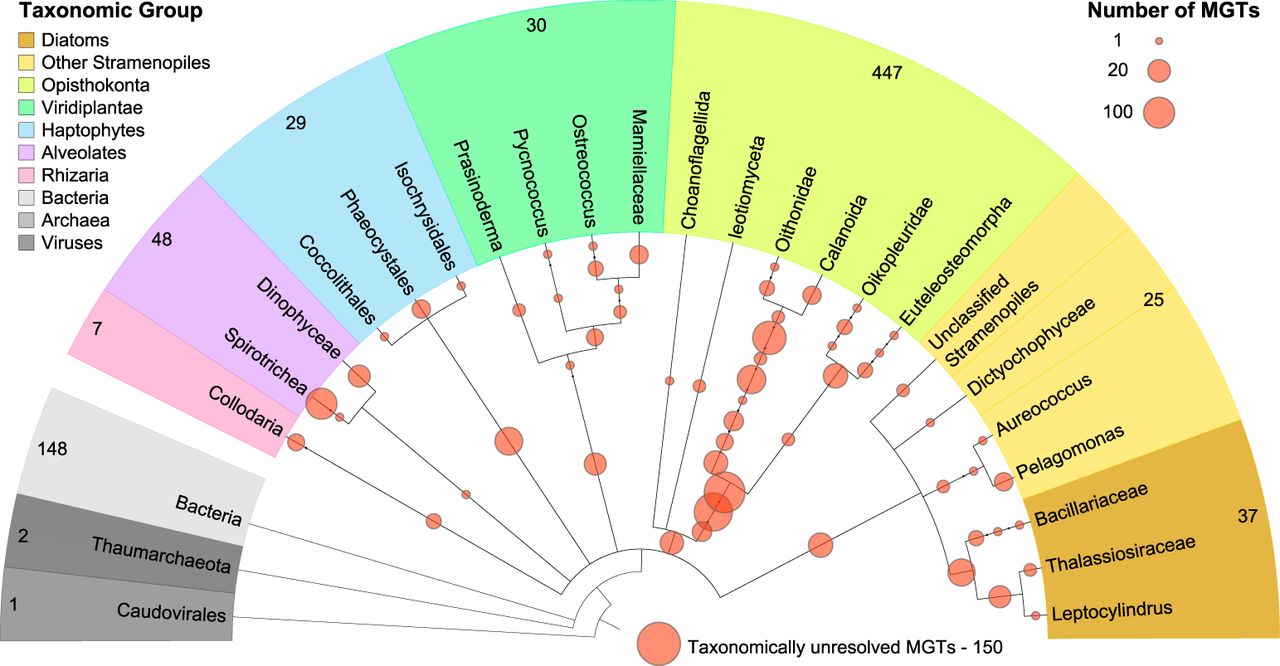
Figure 1.
A taxonomic dendrogram representing the eukaryotic tree of life shows taxonomic positions of MGTs (orange circles) in relation to the major eukaryotic lineages. The size of the circles represents the number of MGTs positioned at a given taxonomic node. The total number of MGTs assigned to each taxonomic group is indicated on the outside of the tree.


